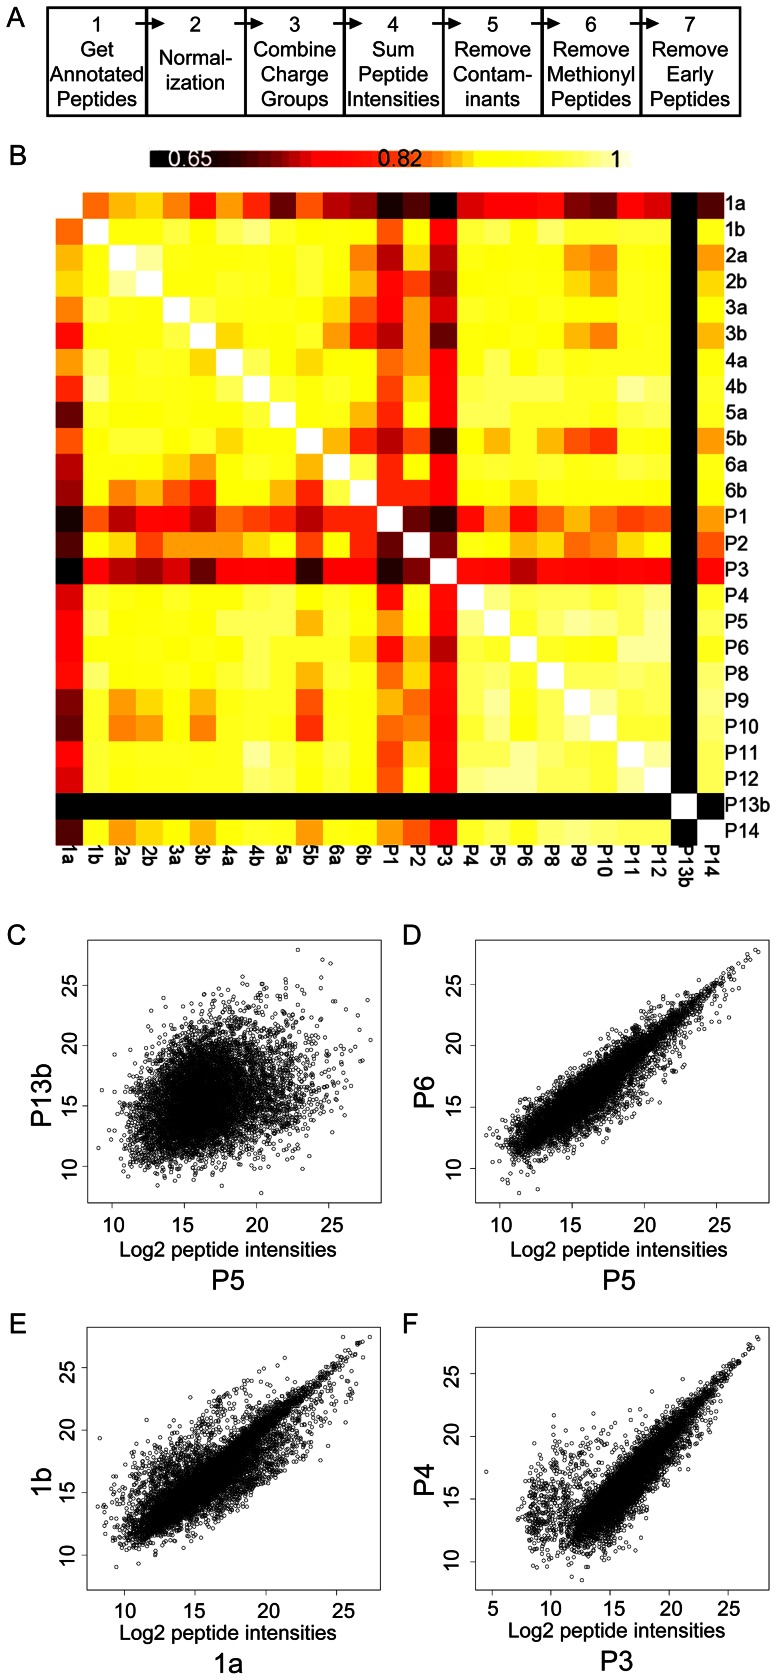
Figure 2. Data processing and symmetrical matrix for all sample pairwise comparisons of log2 annotated peptide intensities.
A. Data processing steps in the visual script used within Rosetta Elucidator™ software. The intensities from the aligned peptide chromatograms were normalized and concatenated to sum signals from all charge states, isotope groups (Steps 1 through 3). Peak intensities of the isotope groups that were assigned to unique peptide sequences within each sample were summed (Step 4) for Pearson correlation coefficients (PCC). Common laboratory contaminants (e.g. keratin) and residual proteins from the MAF procedure (summarized in Table S4) were removed in Step 5. Methionine-containing peptides were removed in Step 6. ‘Early-eluting’ peptides were removed in Step 7. At each step the data were exported from the software and imported into DAnTE-R for further analysis using pair-wise correlations and scatter plots of the log2 transformed intensity data. B. Symmetrical matrix/non-clustering heatmap of PCC values from all pairwise comparisons from the annotated peptide intensity data (center), using a colorimetric scale ranging from black (low correlation, 0.65 and below), to red, orange, yellow, and white (high correlation, maximum 1). Self-pairwise comparisons, which yield a PCC equal to 1.0, appear as the diagonal of white squares. C, D, E, F. Representative scatter plots of all aligned charge group intensities from paired samples: P13b vs P5; P5 vs P6; 1a vs 1b; and P3 vs P4. Units of X- and Y-axes both represent log2 transformed charge group intensities.

