Figure 1.

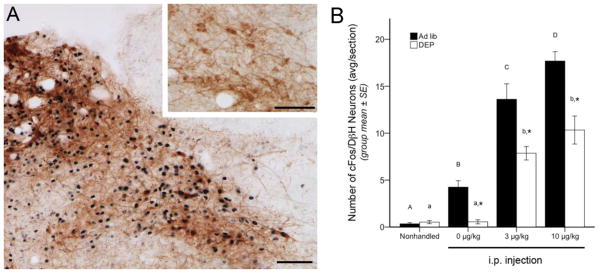
Representative color images and summary data for neuronal cFos expression (black nuclear label) within the A2 region of the caudal NTS. A, NTS cFos activation at the rostrocaudal level of the area postrema, approximately 14.16 mm caudal to bregma. In the larger image, robust cFos expression is present in a rat after CCK (10 μg/kg BW), including activation of DβH-positive (brown) neurons comprising the A2 cell group. Inset, little or no cFos activation is present in an ad lib-fed rat after i.p. vehicle (0 μg/kg BW CCK). B, bar graph illustrating the number of double labeled (i.e., both cFos- and DβH-positive) NTS neurons in ad lib-fed rats (solid bars) or food-deprived rats (DEP; open bars) after no i.p. injection (nonhandled) or after injection of CCK at doses of 0 (vehicle), 3, or 10 μg/kg BW. See Table 1 for two-way ANOVA results. In both feeding status groups, CCK dose-dependently increased cFos expression in DβH-positive A2 neurons, but cFos activation was significantly attenuated in food-deprived rats after vehicle or CCK injections. Asterisks over DEP bars indicate significant differences (p < .05) in the number of double-labeled NTS neurons compared to ad lib-fed rats in the same i.p. treatment group. Within the same feeding status group (i.e., ad lib or DEP), bars with different letters are significantly different (p < .05). Scale bars in A = 100 μm.
