Figure 3.

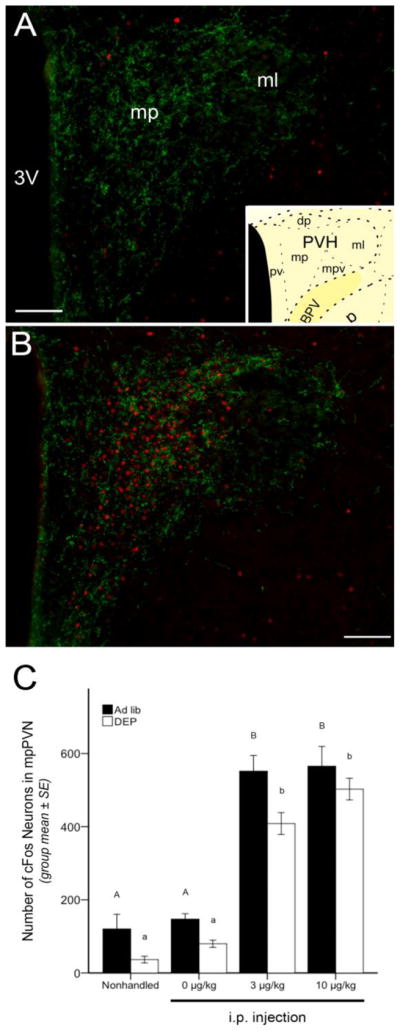
Representative color images and summary data for neuronal cFos expression (red fluorescence) within the GLP-1 (green fluorescence) terminal-rich region of the mpPVN. A, little cFos is present in the mpPVN of an ad lib-fed, nonhandled control rat. B, robust mpPVN cFos activation is present in an ad lib-fed rat injected with CCK (10 μg/kg BW). mpPVN images were captured and cFos quantified in sections approximately 1.78 mm caudal to bregma, as schematized in the inset in panel A [77]. C, bar graph illustrating the number of cFos-positive mpPVN neurons in ad lib-fed rats (solid bars) or food-deprived rats (DEP; open bars) after no i.p. injection (nonhandled) or after injection of CCK at doses of 0 (vehicle), 3, or 10 μg/kg BW. See Table 1 for two-way ANOVA results. In both feeding status groups, low levels of mpPVN cFos activation were present in nonhandled or vehicle-injected rats, and CCK delivered at doses of 3 and 10 μg/kg produced marked activation of mpPVN cFos. Food-deprived rats displayed less mpPVN cFos labeling overall compared to labeling in ad lib-fed rats. Within the same feeding status group (i.e., ad lib or DEP), bars with different letters indicate significant i.p. treatment-induced differences (p < .05) in mpPVN cFos activation. mp = medial parvocellular subdivision of the PVN; ml = lateral magnocellular subdivision of the PVN; 3V = third ventricle. Scale bars in A and B = 100 μm.
