
Figure 1. Circulating 25(OH)D Levels in Cases vs. Controls.
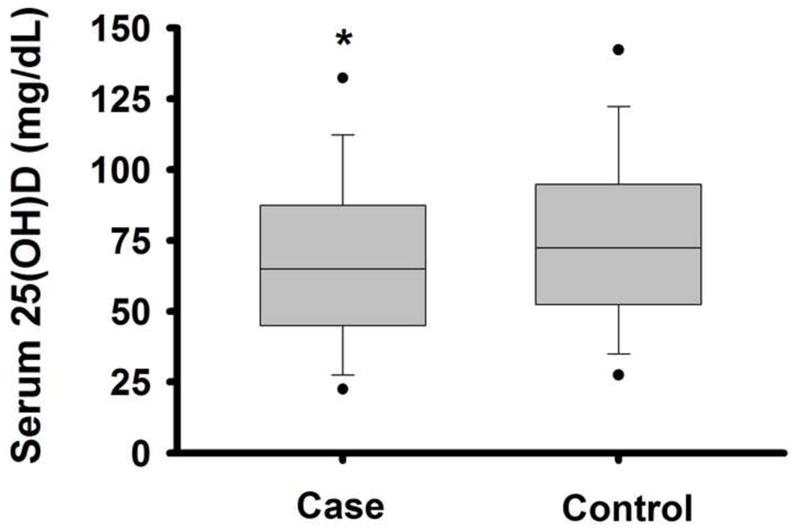
Box-plots of serum 25-hydroxyvitamin D [25(OH)D] levels in non-alcoholic fatty live disease (NAFLD) cases vs. controls. Middle line indicates median, borders of the box indicate the 25th to 75th percentile, whiskers indicate the 10th and 90th percentile, and dots indicate 5th and 95th percentile. * P < 0.0005 vs. control.