
Figure 2. Odds Ratios of NAFLD.
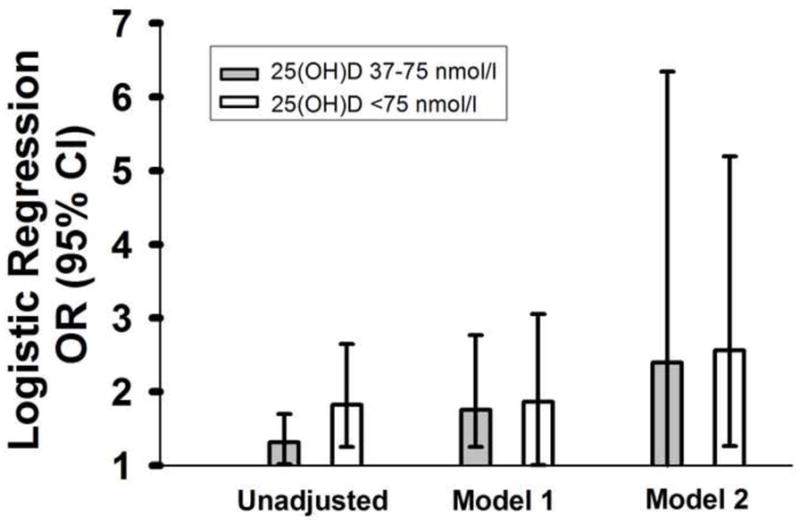
Logistic regression odds ratios (OR; 95% confidence interval [CI]) of non-alcoholic fatty liver disease [NAFLD] according to serum 25-hydroxyvitamin D [25(OH)D] level compared to sufficient (>75 nmol/L [>30 ng/mL]) reference group (gray bars: insufficient (37–75 nmol/L [15–30 ng/mL]); white bars: deficient (<37 nmol/L [<15 ng/mL]). Regression model 1 is adjusted for BMI and history of diabetes, renal disease, peripheral vascular disease and liver disease. Regression model 2 is further adjusted for hypertension.