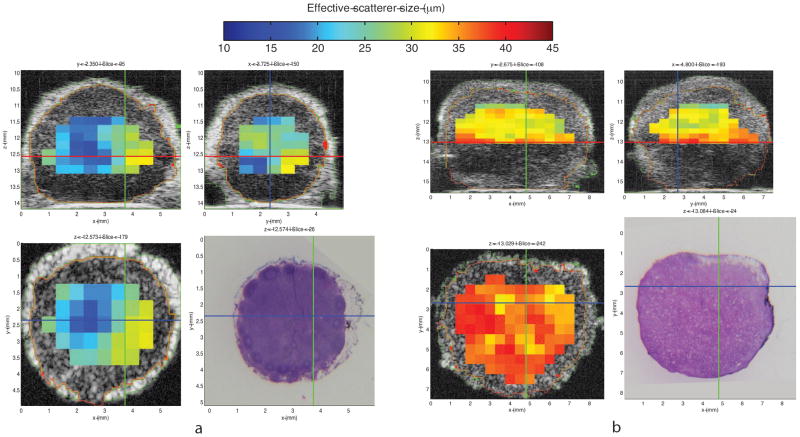
Figure 2.
Illustrative quantitative ultrasound (QUS) images: three-dimensional (3D) cross-sectional parametric images displaying effective scatterer-size estimates. Figure 2-a shows 3D cross-sectional parametric images of a benign locoregional lymph node (LN) from a colon cancer patient. Figure 2-b shows 3D cross-sectional parametric images of a locoregional LN with diffusely metastatic adenocarcinoma from a different colon cancer patient. Parametric cross-sectional B-mode images are shown with overlaid color-coded effective scatterer-size estimates. Bottom right panel of each figure displays the co-registered histology of the bottom left panel.

