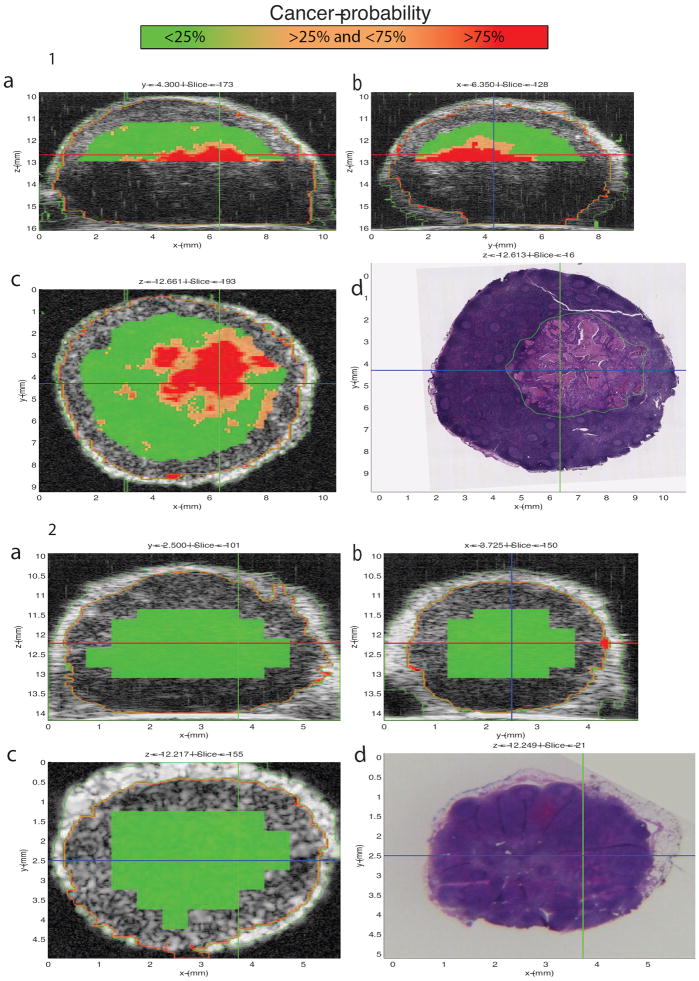
Figure 4.
1: 3D Interactive GUI with cancer-probability images of a locoregional lymph node (LN) with partially metastatic adenocarcinoma from a patient with colorectal cancer. The LN is 9.54 mm in its largest dimension, and the metastasis is 5.09 mm in its largest dimension. The graphical user interface (GUI) displays three orthogonal gray-scale B-mode cross-sections from a three-dimensional (3D) rendering in 4-1a through 4-1c. The cross sections depict color-encoded cancer-probability values using red to indicate a probability greater than 75%, orange to indicate a probability between 25 and 75%, and green to indicate a probability less than 25%. Figure 4-1d shows a co-registered hematoxylin and eosin (H&E) stained histology photomicrograph that corresponds to the same section as in 4-1c. These images show that excellent concurrence is achieved between the red cancer-probability region and the definitive histology result shown in 4-1d showing the demarcated metastatic tumor.
2: 3D Interactive GUI with cancer-probability images of a benign locoregional lymph node (LN) with from a patient with colorectal cancer. The LN is 4.41 mm in its largest dimension. The graphical user interface (GUI) displays three orthogonal gray-scale B-mode cross-sections from a three-dimensional (3D) rendering in 4-2a through 4-2c. Figure 4-2d shows a co-registered hematoxylin and eosin (H&E) stained histology photomicrograph that corresponds to the same section shown in 4-2c. The cross sections depict color-encoded cancer-probability values using red to indicate a probability greater than 75%, orange to indicate a probability between 25 and 75%, and green to indicate a probability less than 25%. These images show that excellent concurrence is achieved between the green cancer-probability region and the definitive histology result of the benign LN shown in 4-2d.

