Figure 5.
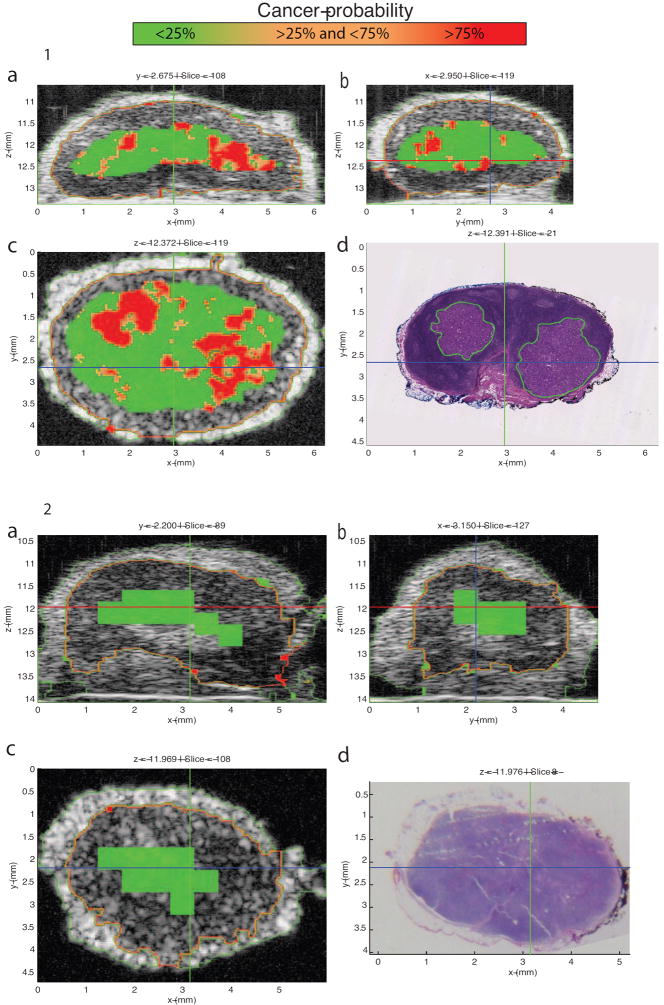
1: Cancer-probability images of an axillary sentinel-lymph node (LN) of invasive ductal breast cancer patient. The LN is 5.86 mm in its largest dimension, and it contains two micrometastatic foci. The bigger focus is 1.82 mm in its largest dimension. The graphical user interface (GUI) displays three orthogonal gray-scale B-mode cross-sections from a three-dimensional (3D) rendering in 5-1a through 5-1c. The cross sections depict color-encoded cancer-probability values using red to indicate a probability greater than 75%, orange to indicate a probability between 25 and 75%, and green to indicate a probability less than 25%. Figure 5-1d shows a co-registered hematoxylin and eosin (H&E) stained histology photomicrograph that corresponds to the same section shown in 5-1c. Like Figure 4-1, Figure 5-1 shows excellent concurrence between the red high-probability region and the corresponding metastatic region in the histology result.
2: Cancer-probability images of a benign axillary sentinel-lymph node (LN) of invasive ductal breast cancer patient. The LN is 5.51 mm in its largest dimension. The cross sections depict color-encoded cancer-probability values using red to indicate a probability greater than 75%, orange to indicate a probability between 25 and 75%, and green to indicate a probability less than 25%. Like Figure 4-2, Figure 5-2 shows excellent concurrence is achieved between the green cancer-probability region and the definitive histology result of the benign LN shown in 5-2d.

