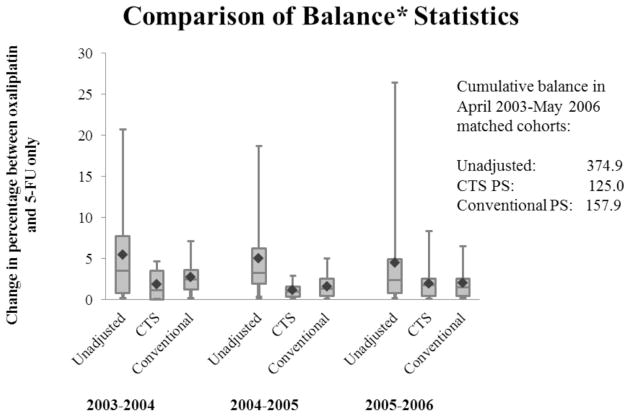
Figure 3. Comparison of covariate balance between full (unmatched) population and matched cohorts generated by the conventional and CTS PS from April 2003 through May 2006.
CTS=Calendar Time-Specific; Time periods are May through April of the years noted. ◆ =Mean; Center line=median; Bottom/Top of box=25th / 75th percentile; Bottom/Top lines=Minimum/Maximum;
Time periods are May through April of the years noted.
*Balance measured by absolute difference in percentage between exposed and unexposed within covariate level for each time period.

