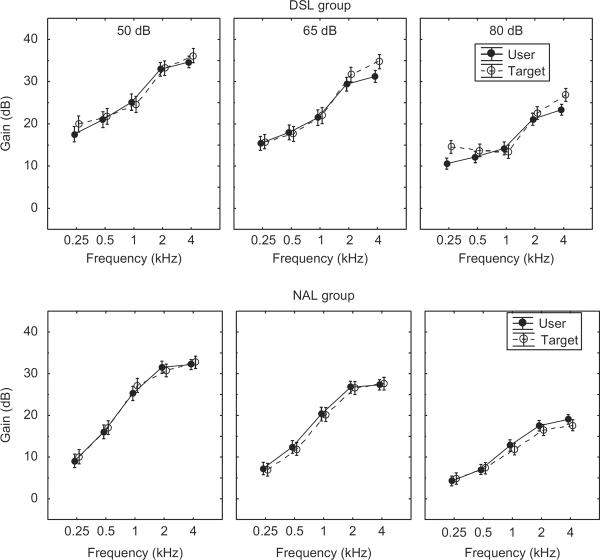
Figure 4.
Mean gains for user settings (solid line with filled circles) and prescribed targets (broken line with open circles) as a function of frequency. Mean values for low input level (50 dB SPL), mid input level (65 dB SPL), and high input level (80 dB SPL) are shown. The top panels depict mean values for the DSL group, and the bottom panels depict mean values for the NAL group.

