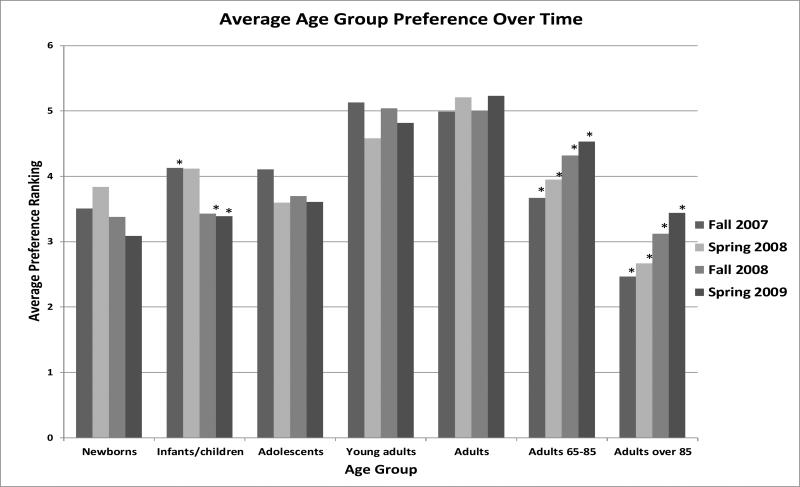
Figure 3.
Average preference for age group over time. Ranks were reverse coded so that a high rank indicates a higher preference for age group. * denote ranks that are significantly different from each other at a p value ≤.008. Specifically the following contrasts were significant; 1) Infants/children Fall 2007 with Fall 2008, 2) Infants/children Fall 2007 with Spring 2009, 3) Adults 65-85 Fall 2007 with Fall 2008, 4) Adults 65-85 Fall 2007 with Spring 2009, 5) Adults 65-85 Spring 2008 with Spring 2009, 6) Adults over 85 Fall 2007 with Fall 2008, 7) Adults over 85 Fall 2007 with Spring 2009, and 8) Adults over 85 Spring 2008 with Spring 2009.

