
TABLE 2.
Treatment outcome parameters in the three groups
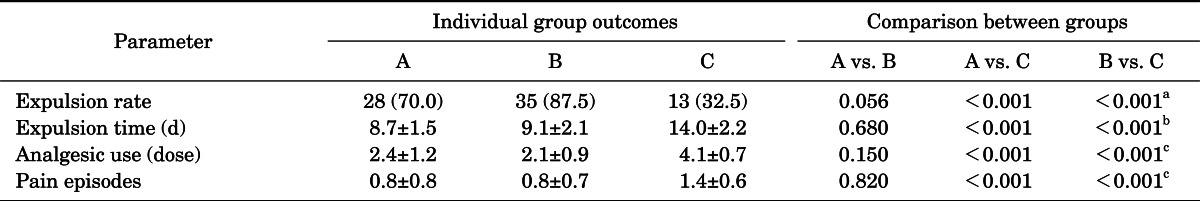
Values are presented as number (%) or mean±standard deviation.
Group A, tamsulosin+prednisolone; group B, naftopidil+prednisolone; group C, watchful waiting.
a:Statistical significance was analyzed by chi-square test. b:Data were analyzed using Kruskal-Wallis test, followed by Mann-Whitney test for comparison between two groups. c:Data were analyzed using analysis of variance, followed by Student-Newman-Kuels method for pair wise comparison.