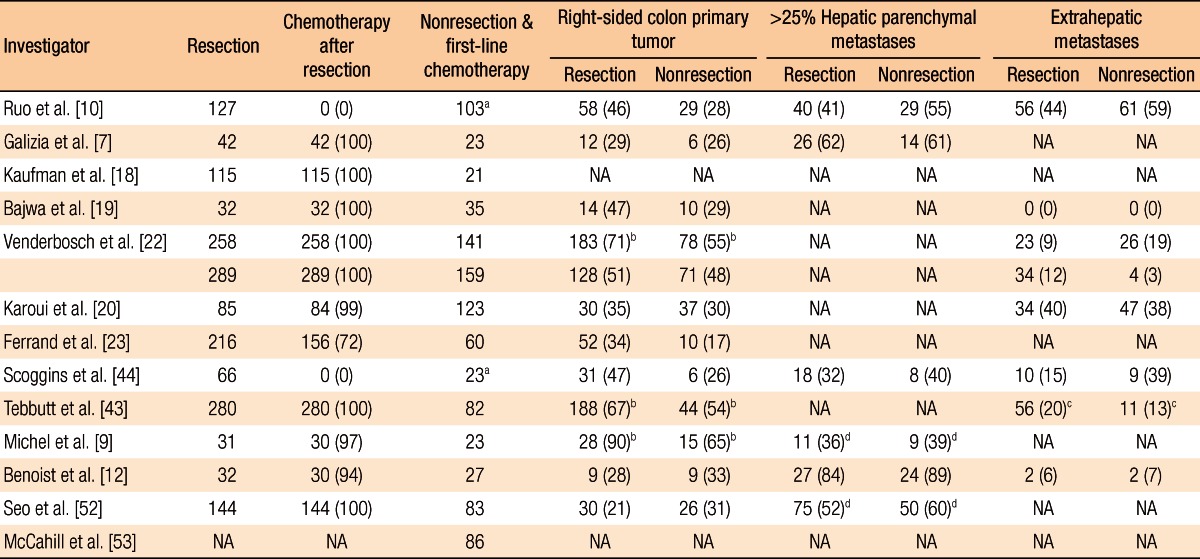
Table 2.
Demographic data from selected studies

Values are presented as number (%).
NA, not available.
aIncluding chemoradiation. bColon. cPeritoneal/omental metastasis. dFive liver metastases or more.
Demographic data from selected studies

Values are presented as number (%).
NA, not available.
aIncluding chemoradiation. bColon. cPeritoneal/omental metastasis. dFive liver metastases or more.