
Figure 3.
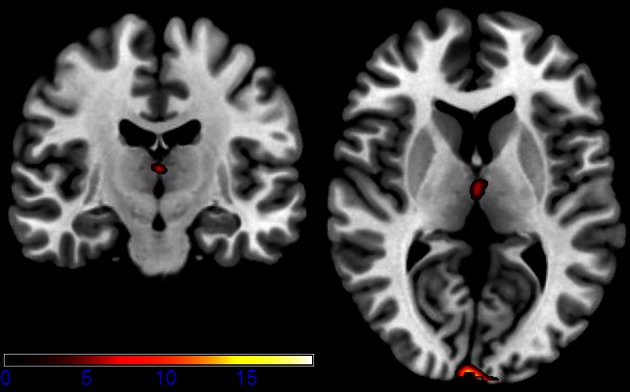
Axial and coronal slices showing significant activation for the main effect runs (for a detailed description of the analysis, please see text; p < 0.001 uncorrected for whole-brain volume analysis; for a more detailed description of activated brain regions, please see Table 1).