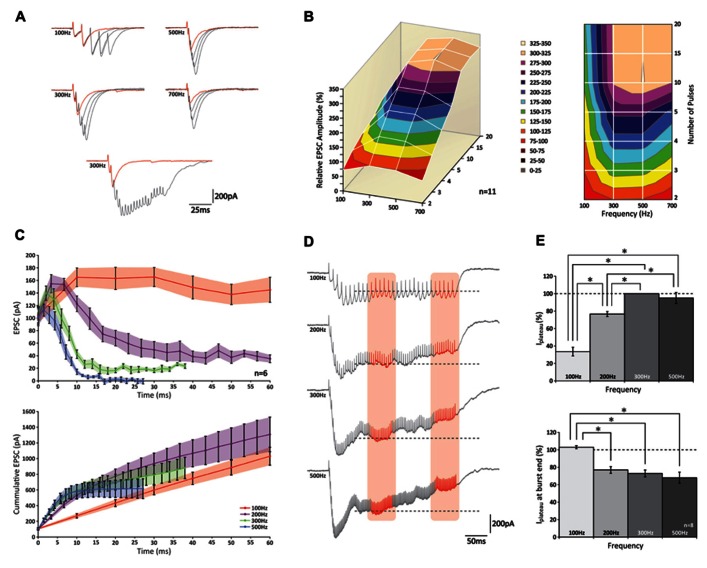
FIGURE 2.
PCs can increase the peak amplitude of their EPSCs following high-frequency stimulation of groups of PFs up to 300 Hz. (A) (top) Traces of PC EPSCs following stimulus bursts of 2, 3, 4, or 5 stimuli at 100, 300, 500, or 700 Hz. Response to two stimuli is shown in red for reference. Note the effect of temporal summation on peak amplitude at higher frequencies. (bottom) Recordings of 2 and 20 stimuli at 300 Hz. Note how in the last half of the long burst no robust responses can be distinguished. (B) 3D representation (left) and top-down view (right) relative peak amplitudes of EPSCs with respect to different stimulus conditions. No increase in EPSC amplitude was observed for bursts of more than 10 stimuli at any of the stimulus frequencies (p > 0.05). (C) Relative EPSC increases per stimulus (top) and cumulative EPSC (bottom) over time. (D) Example traces of EPSCs following prolonged stimulation for 300 ms at 100, 200, 300, and 500 Hz. A plateau was established after ~100 ms for all frequencies. Average current levels were measured early (left orange column) and late (right orange column) during the plateau over a 50 ms time period. Levels measured during first period are indicated by dashed lines for reference. (E) (top) Bar graph of early plateau current levels; no significant increase was observed between 300 and 500 Hz (p < 0.05; n = 8). (bottom) Relative attenuation of plateau current levels at end of burst; no reduction was observed only at 100 Hz (p > 0.05).

