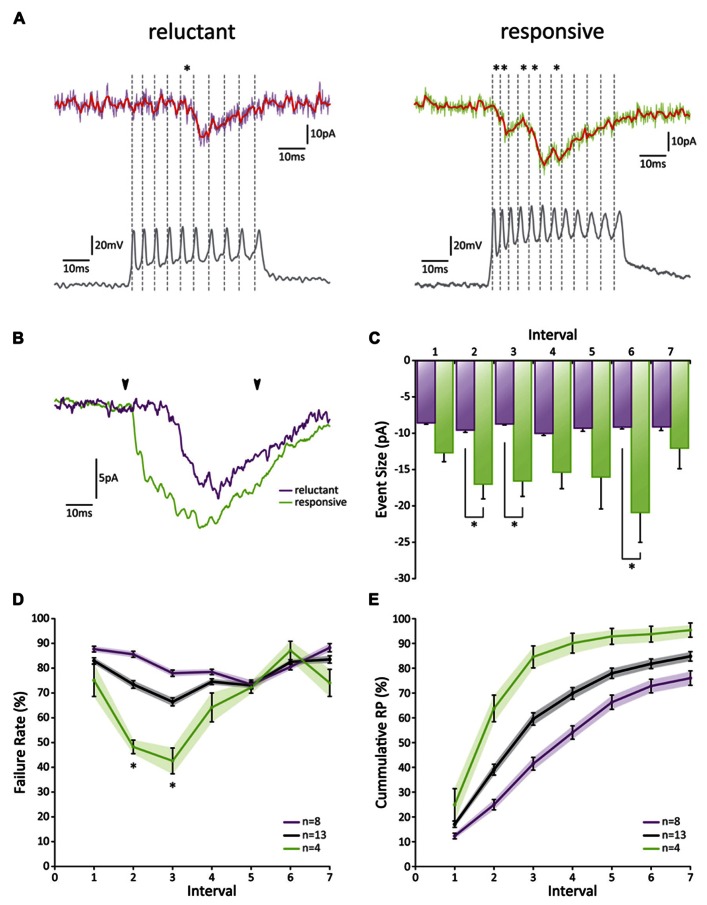
FIGURE 4.
Paired GrC-PC recordings reveal heterogeneity in PF release probability. (A) Examples of paired recordings. Based on the cumulative release probability over the first three spikes, pairs could be subdivided into a “reluctant” group (left) and “responsive” group (right). (top traces) Original voltage clamp recordings from PCs (purple and green for “reluctant” and “responsive” connections, respectively) and their processed signals used for analysis (red); asterisks indicate detected events. (bottom traces) Current clamp recordings from GrCs. Spiking is induced via current injection. Dashed lines indicate detected spikes. (B) Averaged responses over all recordings from cells shown in A. Beginning and end of current injections are indicated by arrowheads. Note a faster overall response in the responsive connection (green). (C) EPSC amplitudes did not change in size during the burst for reluctant connections (purple, p > 0.05 for all comparisons). However, for responsive connections (green) EPSCs elicited by the 2nd, 3rd, and 6th spike were significantly larger than that by the 1st spike. No significant difference was observed between reluctant and responsive connections for EPSCs following the first spike. (D)Failure rate for all recorded pairs (gray), reluctant (purple), and responsive (green) connections. Responsive connections showed a short-lived facilitation for the 2nd and 3rd spike, resulting in a significantly smaller failure rate compared to reluctant connections (p < 0.05; n = 8 and n = 4, respectively; one cell out of the 13 was ambiguous and not included in one of the two main categories). (E) Cumulative probability of release for all recorded pairs (gray), reluctant (purple), and responsive (green) connections.

