
Fig. 2.
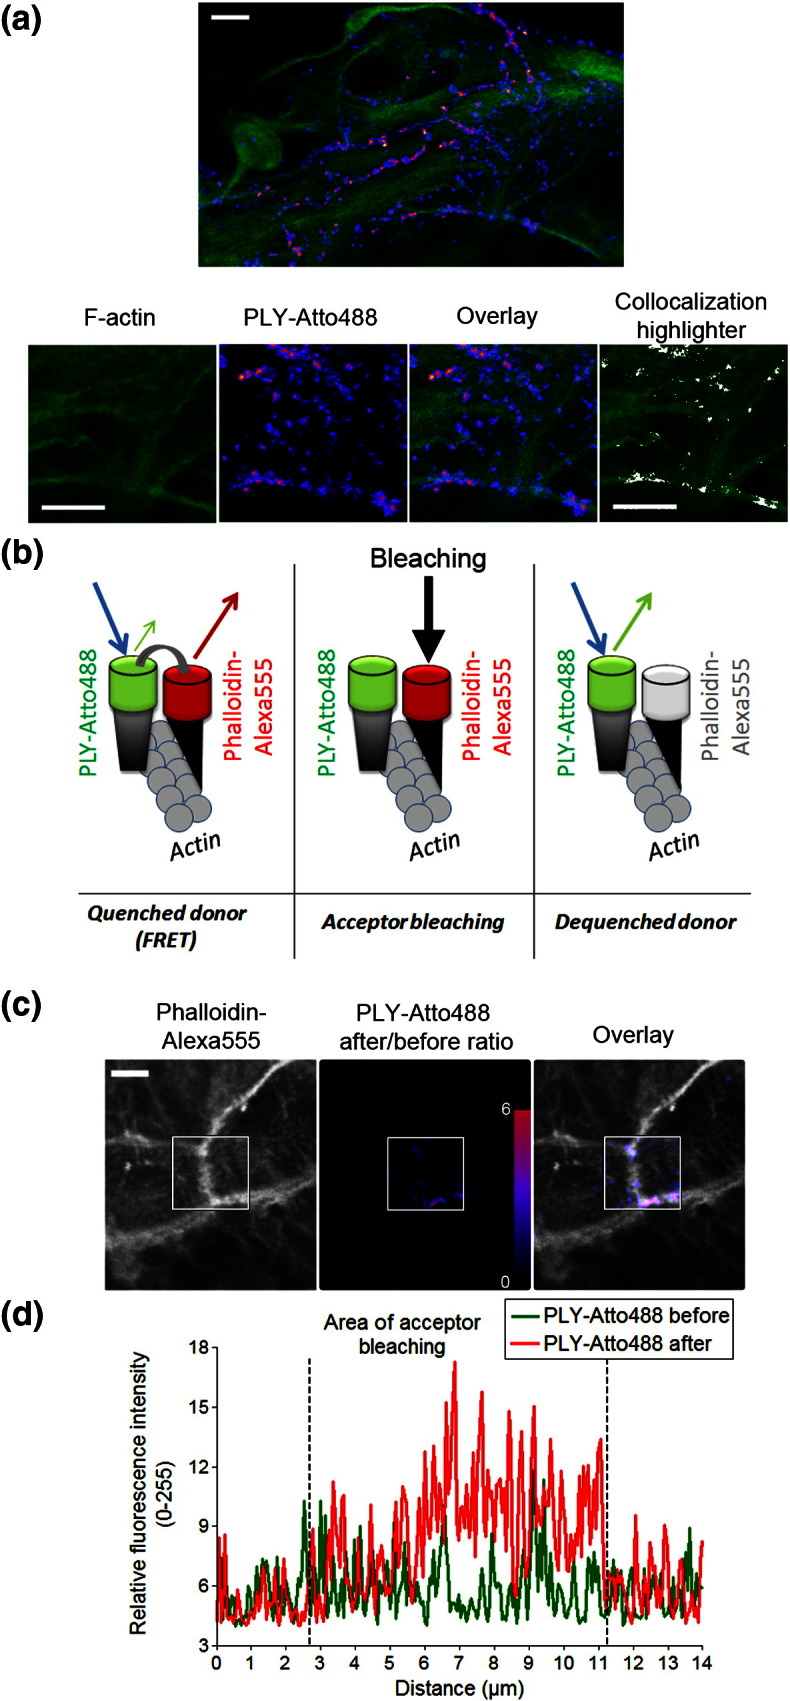
Actin and PLY co-localisation and interaction in astrocytes. (a) Co-localisation between F-actin [stained with phalloidin (green)] and PLY [Atto488-tagged, 0.2 μg/ml (blue–magenta)] in astrocytes 90 s after toxin exposure (a single confocal plane along the surface of the cell). The co-localisation highlighter plugin from ImageJ is applied with standard settings (ratio, 50%; channel threshold, 50). The scale bar represents 10 μm. (b) Principle of FRET measurements via acceptor photobleaching. In the case of FRET (at the molecular interaction distance between the donor and the acceptor), the donor fluorescence is quenched by the acceptor. Upon bleaching of the acceptor, the donor is de-quenched, and its fluorescence increases. PLY is labelled with Atto488 (PLY-Atto488; donor), and F-actin is labelled with phalloidin-Alexa555 (acceptor). (c) Phalloidin staining of cortical F-actin in an astrocyte monolayer, showing the border region fragments of four cells tightly attached to each other. The ratio of donor fluorescence before/after bleaching of the acceptor demonstrates the presence of strong FRET along the phalloidin-positive subcortical F-actin structures 120 s after the PLY-Atto488 challenge. The scale bar represents 10 μm. (d) Representative profile scan along the cortical actin structures shown in (c) demonstrating the changes in donor fluorescence after bleaching.