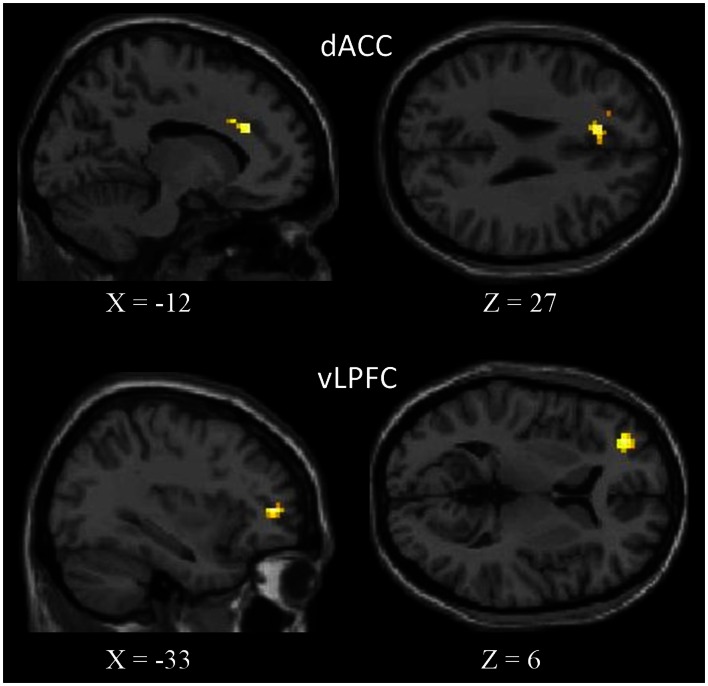
Figure 2.
Areas showing negative correlation with the NCS. In the upper part of figure, the dorsal anterior cingulate cortex (dACC), and in the bottom, the ventro-lateral prefrontal cortex (vLPFC). Results are superimposed to a single subject T1-weighted image normalized to the MNI stereotaxic space. Results are significant at a threshold of p < 0.01 (uncorrected) with an extended threshold of k = 10.

