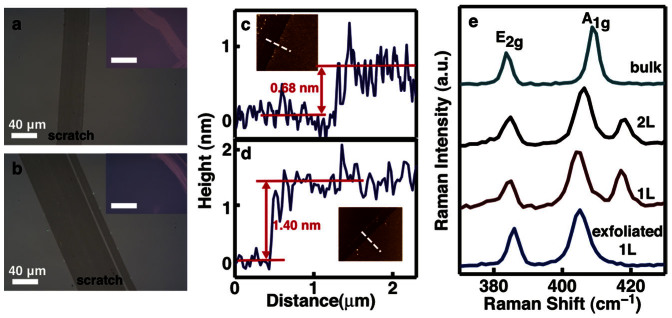
Figure 1. Controlled synthesis of MoS2 monolayer and bilayer films.

(a) and (b), Optical images of the MoS2 monolayer and bilayer films grown on sapphire substrates, respectively. The insets are optical images of the MoS2 monolayer and bilayer films grown on SiO2/Si substrates. The scale bars in the insets are 80 μm. (c) and (d), AFM height profiles for typical MoS2 monolayer and bilayer films grown on sapphire, respectively. The insets show the AFM images from which the height profiles are extracted. A larger version of the AFM images is given in Fig.S3 of the Supplementary Information. (e), Raman spectra of the MoS2 monolayer (1 L) and bilayer (2 L) films grown on sapphire. Also given are the Raman spectra of exfoliated MoS2 monolayer and bulk MoS2 dispersed on SiO2/Si substrates. The two characteristic Raman modes are labeled. The peak at 418 cm−1 is from the sapphire substrate.
