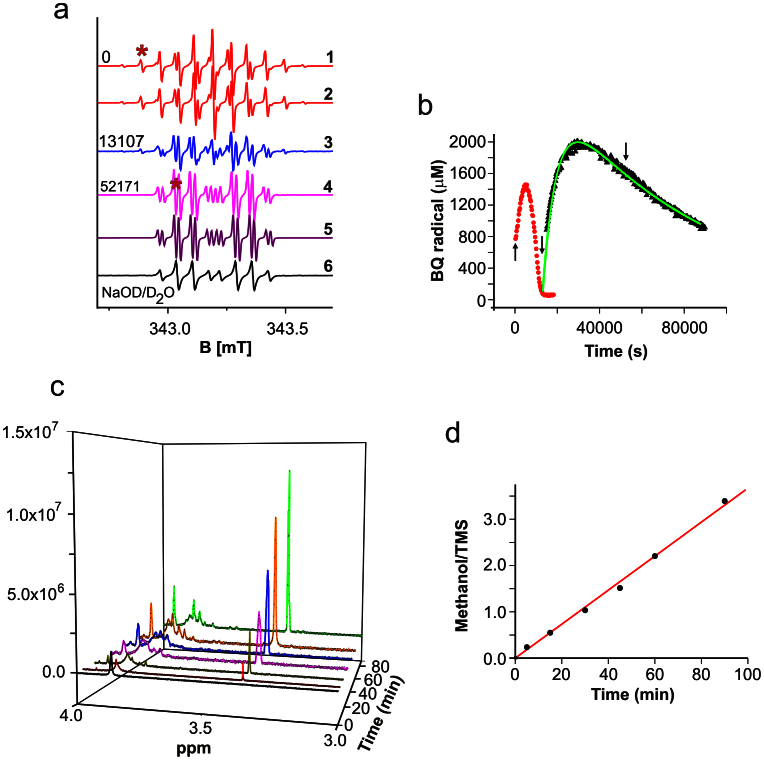
Figure 3. Structural transformations of 2,6-dimethoxy benzoquinone in alkaline pH observed by EPR and NMR.
a) EPR spectra of 5 mM BQ in 0.1 M NaOH (NaOD) at times (in s) indicated and spectral simulations. Asterisks mark lines used for quantitative evaluation in b. b) Evolution of primary and secondary radical, arrows indicate the corresponding spectra in a, the green curve is a fit with sequential reaction model. c) NMR spectra in the methanol and methoxy proton region of 1 mg/mL BQ reacted in 0.1 M NaOD for different times, and re-titrated to pD ~7 with DNO3. d) Ratio of the relative integrals from the signal of methanol and TMS.

