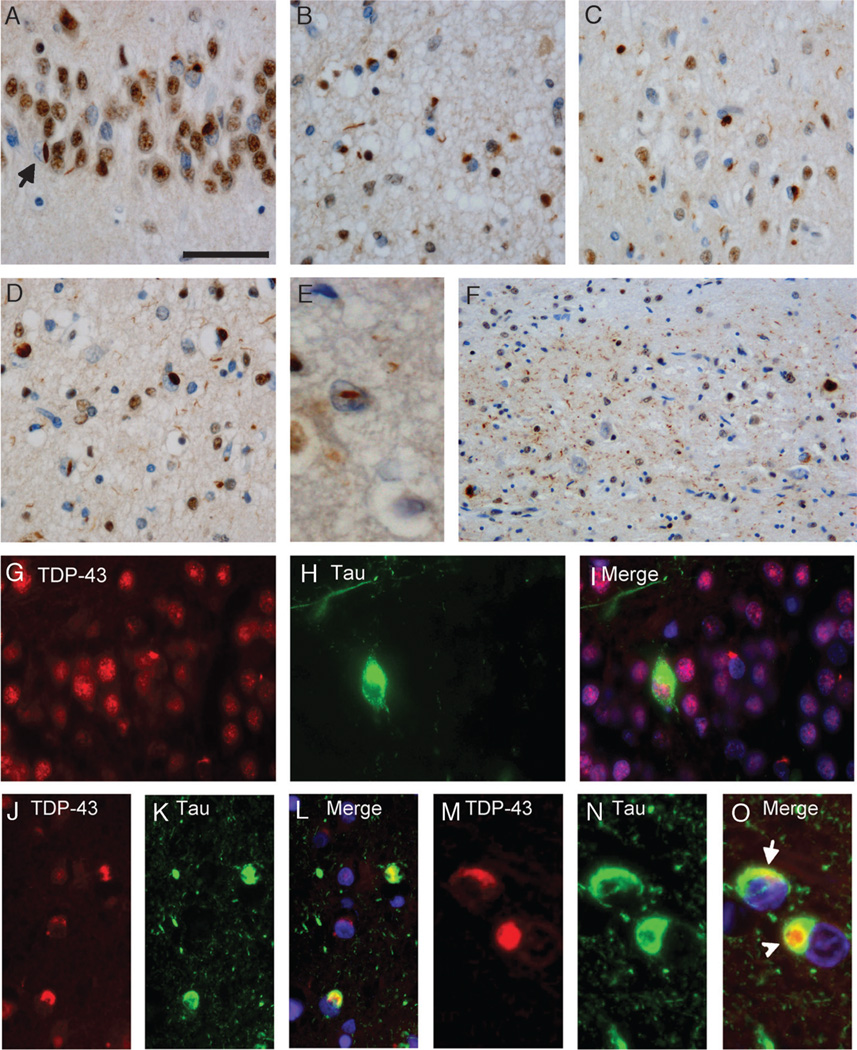
FIGURE 1.
TAR-DNA-binding protein 43 (TDP-43) pathology in Alzheimer disease (AD). Immunohistochemistry with anti-TDP-43 showing neuronal cytoplasmic inclusions in dentate granule cells (A). Note the neuronal intranuclear inclusion (NII) (A; arrow). Cytoplasmic inclusions and small neuritic profiles in entorhinal cortex (B), temporal cortex (C), and frontal cortex (D) in a case with diffuse TDP-43 pathology. Higher magnification of an NII in the frontal cortex is shown (E). An AD case with hippocampal sclerosis shows abundant neuritic pathology in the CA1 region (F). (G–O) Double label immunofluorescence with anti-TDP-43 (G, J, M) and anti-tau (H, K, N). Merged images show cell nuclei stained with 4′6-diamidino-2-phenylindole (I, L, O). Inclusions in the dentate granule cells are either labeled by anti-TDP-43 or anti-tau (G–I). Partial colocalization of tau and TDP-43 signals is observed in neurons in the entorhinal cortex, whereas the neuritic tau pathology is not stained by anti-TDP-43, and 2 TDP-43-positive neuronal inclusions are not labeled by anti-tau (J–L). (M–O) Higher magnification of neurons with partially overlapping (O; arrow) or separate TDP-43- and tau-positive inclusions (O; arrowhead). Scale bars = (A) 50 (A–D, G–L); (E) 25; and (M–O) 20 µm.

