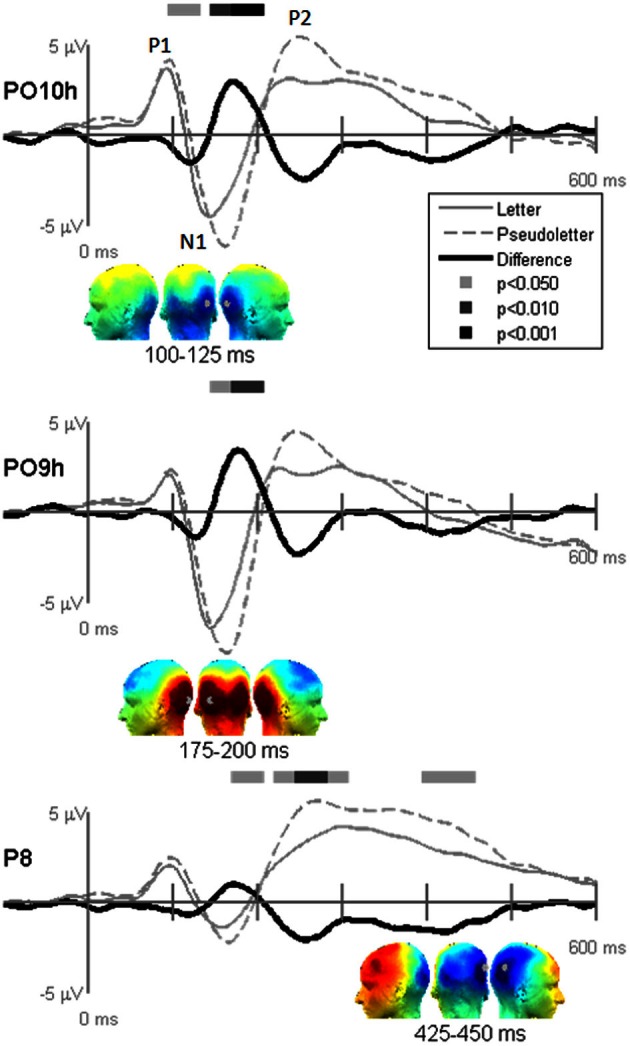
Figure 4.

Grand-mean evoked potentials for Stimulus effects averaged across tasks (Orthography, Color, and Target) at electrodes PO10h, PO9h, and P6. Bars above the waveforms designate intervals of significant differences between letters and pseudoletters at p < 0.05, p < 0.01, and p < 0.001. Scalp topographies plotted under the waveforms reflect difference waveforms averaged across the designated intervals shown for left, posterior, and right views. The gray dots in the topographies reflect the electrode location for the waveforms plotted above.
