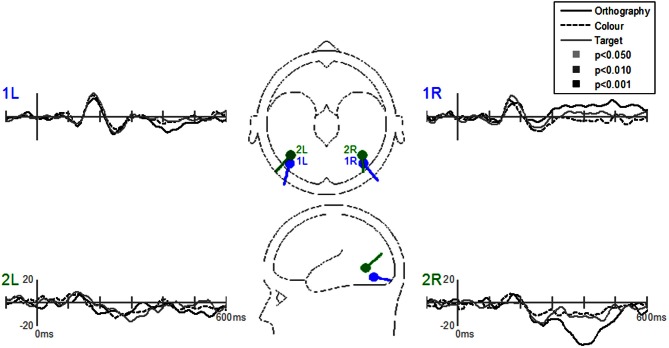
Figure 9.
Grand-mean source waveforms for the Interaction of Task by Stimulus for the Stimulus-effects model (inset) with bilateral dipoles in the fusiform gyri (dipoles 1L and 1R) and bilateral inferior temporal gyri (dipoles 2L and 2R). Waveforms are plotted as the differences between letter and pseudoletters for each task (Orthography, Color, and Target). No statistical evidence of significant interactions were found in these source waveforms at p < 0.05, p < 0.01, and p < 0.001. Vertical axis scale for waveform plots is in nAmp.

