
Figure 3.
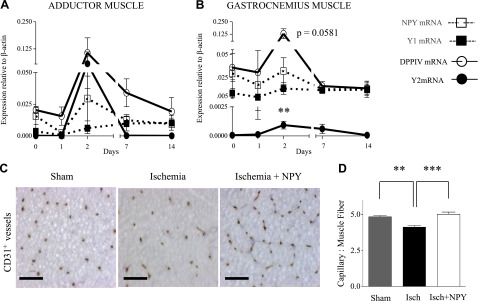
Time-dependent expression of the NPY system in rat ischemia. A, B) mRNA expression levels at similar time points of adductor (A) and gastrocnemius (B) muscles following FAL in Wistar rats, measured by real time RT-PCR. Data are presented as mean ± se expression relative to β-actin (n=3–8/time point). **P < 0.01 vs. d 0; 1-way ANOVA with post hoc Bonferroni's test. C) Representative cross sections of gastrocnemius muscle from Wistar rats 5 d following sham operation, FAL or FAL and NPY (slow-release pellet, 1 μg/pellet/14 d) immunostained with CD31 for microvessel density. Scale bars = 50 μm. D) Quantification of CD31+ vessels. Data are presented as mean ± se capillary-to-muscle fiber ratio (n=6/group). **P < 0.01, ***P < 0.001; 1-way ANOVA with post hoc Bonferroni's test.