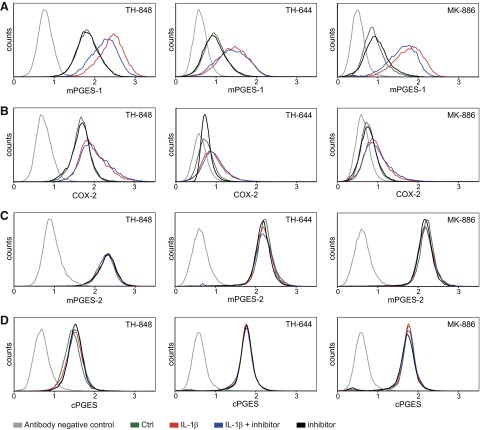
Figure 3.
Effects of TH-848, TH-644, and MK-886 on protein expression of the PGES isoenzymes mPGES-1, mPGES-2, and cPGES, as well as the upstream enzyme COX-2. Gingival fibroblasts were treated with IL-1β (0.5 ng/ml) in the absence or presence of TH-848 (2 μM), TH-644 (2 μM) or MK-886 (4 μM) for 24 h. Control (Ctrl) cells were treated with culture medium only. Protein expression of mPGES-1 (A), COX-2 (B), mPGES-2 (C), and cPGES (D) was analyzed using flow cytometry and presented as histograms of cell counts vs. logarithmic fluorescence intensity. Results shown represent ≥3 independent experiments.

