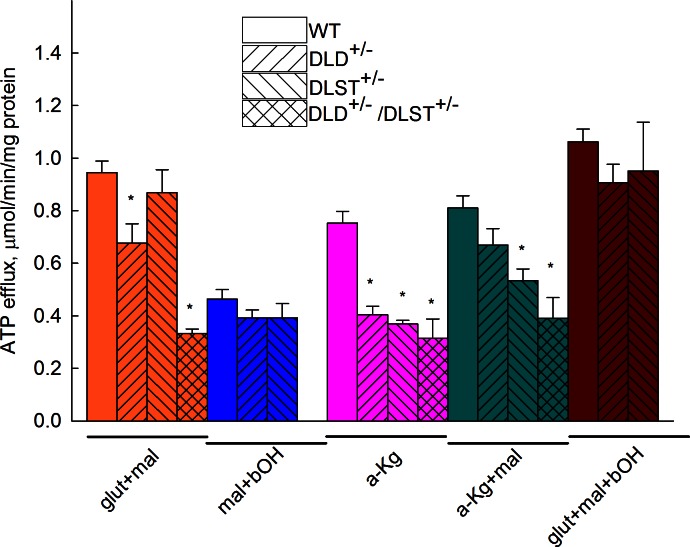
Figure 3.
ATP efflux rates of isolated brain mitochondria of WT, DLD+/−, DLST+/− and DLD+/−/ DLST+/− mice as a function of various substrate combinations. Substrate concentrations: glutamate (glut), 5 mM; malate (mal), 5 mM; β-hydroxybutyrate (bOH), 2 mM;, α-ketoglutarate (a-Kg), 5 mM). P values for the various substrate combination groups: glut+mal, P < 0.001; a-Kg, P < 0.001; a-Kg+mal, P < 0.001. *P < 0.05 vs. WT control mice; 1-way ANOVA followed by Dunnett's test post hoc analysis if comparing ≥3 groups.

