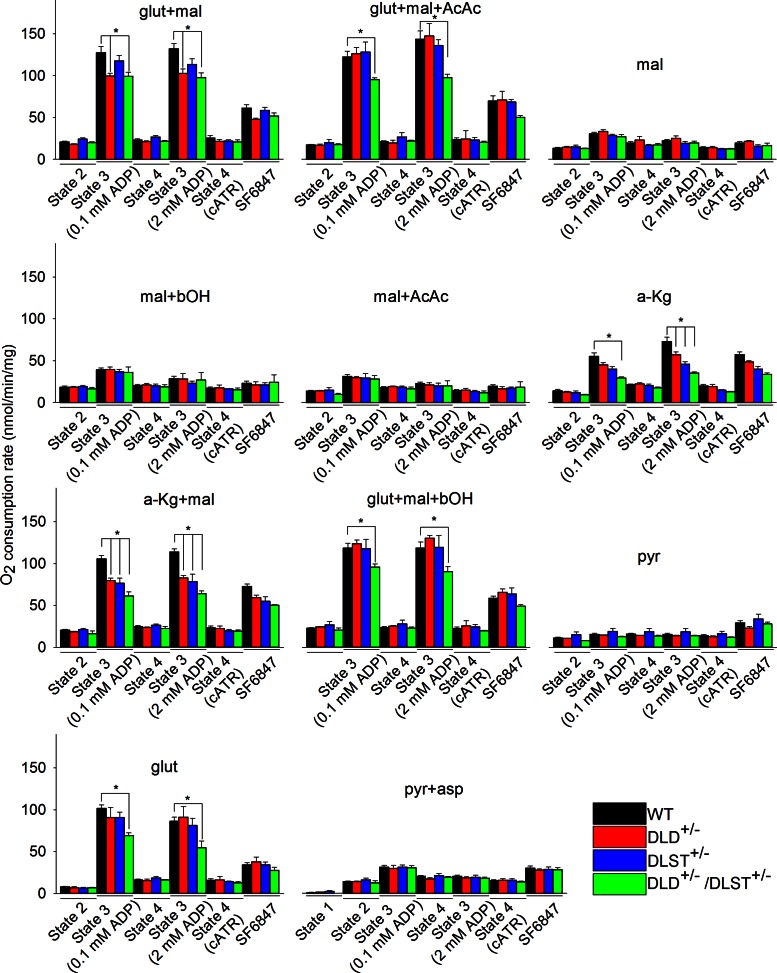
Figure 4.
Respiration rates of isolated brain mitochondria of WT, DLD+/−, DLST+/−, and DLD+/−/ DLST+/− mice for various substrate combinations indicated in the panels. Substrate concentrations: glutamate (glut), 5 mM; malate (mal), 5 mM; acetoacetate (AcAc), 0.5 mM; β-hydroxybutyrate (bOH), 2 mM; α-ketoglutarate (a-Kg), 5 mM; pyruvate (pyr), 5 mM; aspartate (asp), 5 mM. At the end of each experiment, 50 nM SF 6847 was administered. P values were as follows: glut-mal: 0.1 mM ADP bolus, 0.002; glut-mal with 2 mM ADP bolus, 0.002; glut-mal-AcAc: 0.1 mM ADP bolus, 0.026; 2 mM ADP bolus, 0.006; α-Kg: 0.1 mM ADP bolus, 0.002; 2 mM ADP bolus, <0.001; α-Kg-mal: 0.1 mM ADP bolus, <0.001; 2 mM ADP bolus, <0.001; glut+mal+bOH: 0.1 mM ADP bolus, 0.021; 2 mM ADP bolus, 0.015; glut: 0.1 mM ADP bolus, 0.011; 2 mM ADP bolus, 0.022. State 1 (no mitochondria, no substrates) is shown only in bottom middle panel (pyr+asp). *P < 0.05 vs. WT control mice; 1-way ANOVA with Dunnett's test post hoc analysis.

