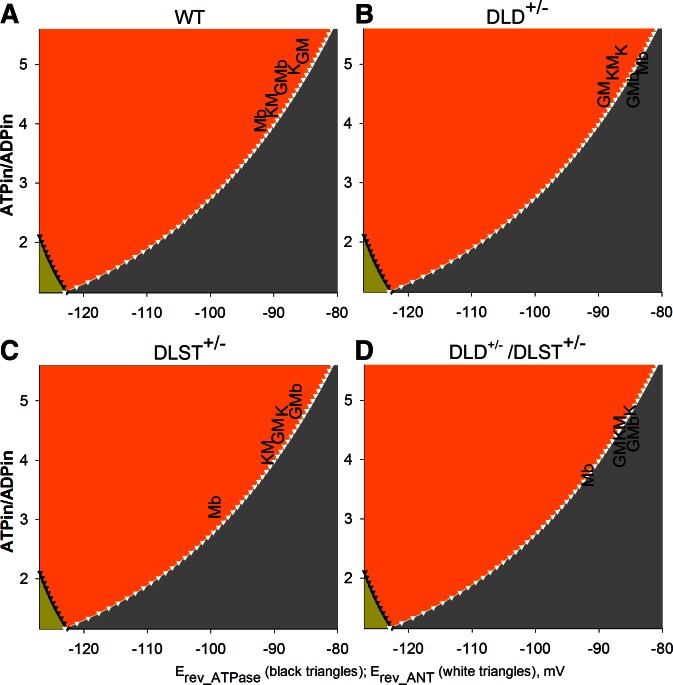
Figure 8.
Predicted ranges of matrix ATP/ADP ratios (ATP/ADPin) for each substrate combination used for brain mitochondria from WT mice (A) vs. DLD+/− (B), DLST+/− (C), and DLD+/−/DLST+/− (D) KGDHC-deficient mice, after inhibition by rotenone. Substrates: G, glutamate; M, malate; b, β-hydroxybutyrate; K, α-ketoglutarate. For each substrate combination found in the B space (orange), the range of values that the matrix ATP/ADP ratio may attain is from Erev_ANT for the respective membrane potential and upwards. If the substrate combination is found in the C space (gray), the range of values that the matrix ATP/ADP ratio may attain is from Erev_ANT for the respective membrane potential until theoretical zero.

