Abstract
The membrane receptor (TCblR/CD320) for transcobalamin (TC)-bound cobalamin (Cbl) facilitates the cellular uptake of Cbl. A genetically modified mouse model involving ablation of the CD320 gene was generated to study the effects on cobalamin homeostasis. The nonlethal nature of this knockout and the lack of systemic cobalamin deficiency point to other mechanisms for cellular Cbl uptake in the mouse. However, severe cobalamin depletion in the central nervous system (CNS) after birth (P<0.01) indicates that TCblR is the only receptor responsible for Cbl uptake in the CNS. Metabolic Cbl deficiency in the brain was evident from the increased methylmalonic acid (P<0.01–0.04), homocysteine (P<0.01), cystathionine (P<0.01), and the decreased S-adenosylmethionine/S-adenosyl homocysteine ratio (P<0.01). The CNS pathology of Cbl deficiency seen in humans may not manifest in this mouse model; however, it does provide a model with which to evaluate metabolic pathways and genes affected.—Lai, S.-C., Nakayama, Y., Sequeira, J. M., Wlodarczyk, B. J., Cabrera, R. M., Finnell, R. H., Bottiglieri, T., Quadros, E. V. The transcobalamin receptor knockout mouse: a model for vitamin B12 deficiency in the central nervous system.
Keywords: cellular uptake, nullizygous, methylmalonic acid, homocysteine, CD320
Vitamin B12 deficiency in humans produces anemia with megaloblastic changes in the bone marrow and central nervous system (CNS) abnormalities in the form of neuropsychiatric disturbances and peripheral neuropathy (1). The consistent pathology in the nervous system observed in B12 deficiency is demyelination in the spinal cord and peripheral nerves (2). A clear metabolic link has been identified for the megaloblastic marrow and anemia, in the form of 5-methyltetrahydrofolate (5MTHF) entrapment leading to defective DNA synthesis (3). Therefore, the anemia of B12 deficiency is indirect, brought on by the inability of methionine synthase, which requires methyl cobalamin (Cbl) to convert methyl folate to tetrahydrofolate, an essential step in the recycling of folate. The only other pathway and enzyme involving Cbl is the conversion of methylmalonyl CoA to succinyl CoA by the methylmalonyl CoA mutase, which utilizes adenosyl Cbl as a cofactor (4). The elevated methyl malonic acid (MMA) in Cbl deficiency is due to a block in his pathway (5). Total B12 or holo transcobalamin (TC) in the serum are good indicators of Cbl status. The metabolite homocysteine (HCY) is elevated in both folate and Cbl deficiency, and MMA is elevated only in Cbl deficiency (6). Even though the clinical presentations of Cbl deficiency are well documented, the metabolic pathways linking Cbl deficiency to the neuropathology and especially the characteristic demyelination remain unexplained. Understanding the metabolic basis of demyelination is of the utmost importance in understanding this and other clinical disorders resulting from demyelination. Identifying pathways and genes involved are likely to provide new insights into preventing and treating these disorders, which, if not treated promptly, could lead to irreversible neurological deficits. The transcobalamin receptor (TCblR)/CD320 gene encodes the ubiquitous receptor for the cellular uptake of TC-bound Cbl (7). The CD320-knockout (KO) mouse provides, for the first time, an animal model with which to induce metabolic Cbl deficiency to study pathways and genes affected. This report provides the first evaluation of Cbl and metabolite status in the TCblR/CD320 KO mouse.
MATERIALS AND METHODS
The TCblR-KO mouse embryonic stem (ES) cells (+/−) generated by gene trap technology at the Welcome Trust Sanger Institute (London, UK) were obtained from the Mouse Genome Center, University of California–Davis (Davis, CA, USA). The pGT01xft2 vector contained the pUC backbone and the targeting sequence inserted upstream of the β-geo gene encoding nonfunctional fusion protein and a poly(A) tail (8). The insertion of the trap cassette in intron1 between exon1 and exon2 of CD320 gene gDNA was confirmed by sequence analysis. Six targeted ESC clones were identified and microinjected into C57BL/6 (albino) blastocysts to generate chimeric animals, which were bred to C57BL/6 (albino) females, and the resulting heterozygous (CD320+/−) offspring were interbred to produce homozygous CD320−/− embryos. Procedures involving animals were conducted in conformity with the Institutional Animal Care and Use Committee guidelines that are in compliance with the state and federal laws and the standards outlined in the U.S. National Institutes of Health Guide for the Care and Use of Laboratory Animals.
The mice were maintained at the State University of New York (SUNY) Downstate Medical Center (Brooklyn, NY, USA) for the characterization studies and were fed ad libitum with Lab Diet 5001 (PMI International, St. Louis, MO, USA). The initial genotyping was done by PCR using mouse tail genomic DNA. Forward primer was located in exon1, and the reverse primer for wild type (WT) was located in intron 2 and for the null in the inserted vector. The sequences of genotyping primers for WT (+/+) and KO (−/−) were as follows: WT, forward GGTCTCAGAACAGGCCTA, reverse GTGAGACCCTGTTTGGAA; null, forward GGTCTCAGAACAGGCCTA, reverse TGTCAGGGTCACAAGGTTCA. The size of the PCR product for WT was 736 bp and for KO was 549 bp. The PCR product from the heterozygous mouse shows both bands.
qRT-PCR analysis
Total RNA was isolated by using Trizol reagent (Invitrogen, Carlsbad, CA, USA). ES cells in culture were washed with 1 ml Hank's balanced salt solution, Trizol reagent was added to the flask containing cells, and total RNA was extracted using the protocol provided by the manufacturer. For mouse tissues, 100 mg wet weight tissues were homogenized in 1 ml Trizol reagent to extract total RNA. Total RNA (1 μg) was used for first-strand cDNA synthesis using SuperScript II reverse transcriptase and random primers (Invitrogen). A sample of the first-strand cDNA synthesis product (20 μl) was further diluted 1:10, and 2 μl was used for qRT-PCR with SYBR GreenER supermix for ABI PRISM (Invitrogen), mouse TCblR (forward 5′-CGGGTCCAAGTCTCCGGCTCTAGAGCTC-3′, reverse 5′-AGTCTTCCTCGTCACTGCCATCAGAGCA-3′) and megalin (forward 5′-AGGCCACCAGTTCACTTGCT, reverse 5′-AGGACACGCCCATTCTCTTG) primers to amplify these genes. Mouse β-actin (forward 5′-TGGCACCACACCTTCTACAATGAGC-3′, reverse 5′-GCACAGCTTCTCCTTAATGTCACGC-3′) was used as internal control. PCR amplification and fluorescence detection were performed in an ABI StepOne qPCR instrument (Applied Biosystems) under the following conditions: 95°C for 10 min, followed by 40 cycles of 95°C, for 15 s and 60°C for 1 min). The fold change was calculated by the relative comparison method, ΔΔCt.
Total B12 assay
The mice in each group (nullizygous, heterozygous, and WT) were placed on a water-only diet overnight before euthanasia. After the mouse was euthanized, the blood was collected to obtain serum. The mouse tissues, such as brain, liver, spleen, and kidney, were removed and rinsed with PBS, followed by blotting to remove excess solution. Tissue was weighed and homogenized in 2 to 4 vol of distilled water based on the expected amount of Cbl in each type of tissue. The homogenized tissue (100 μl) was mixed with 9 vol of Cbl extraction buffer (1 vol 0.06 M citrate-phosphate buffer, pH 2.6; 1 vol 0.1 M Na2HPO4, pH 7.4; and 1 vol KCN, 100 μg/ml; final pH of extraction buffer was 4.5); 100 μl of mouse serum was mixed with 900 μl Cbl extraction buffer (pH adjusted to 4.5 with citric-phosphate buffer, pH 2.6, for each sample) in a tightly capped glass tube and placed in a boiling water bath for 30 min to extract the Cbl. The sample was briefly centrifuged after cooling to room temperature and transferred to a 1.5-ml microcentrifuge tube. The debris was pelleted by centrifugation at 14,000 rpm for 15 min, and the clear extract was collected, neutralized by mixing with 1/3 vol 0.2 M Na2HPO4 (pH 9.0), and used for total B12 assay. The Cbl binding protein used for this assay was recombinant human TC. The TC was first diluted to 1:100 with 0.025% BSA/1× PBS, and the binding capacity was determined by mixing with 7000 cpm 57Co-labeled Cbl tracer and assay buffer. The amount of TC used for assay should bind 40–60% of the 57Co-labeled Cbl tracer. Cyano Cbl was used for the standard curve in assay buffer (pH 7.4; 1 vol each of 0.06 M citrate-phosphate buffer pH 2.6; 100 μg/ml KCN; and 0.2 M dibasic sodium phosphate, pH 9) and Ringer's bicarbonate buffer (110 mM sodium chloride, 2 mM potassium chloride, and 2 mM sodium bicarbonate, pH 7.4) and 3 vol of the extract was assayed for total Cbl. The following solutions were added in order: 7000 cpm 57Co-labeled Cbl tracer and TC (1 ml final volume). The mixtures were briefly mixed and incubated for 1 h at room temperature. Hemoglobin-coated charcoal (500 μl) was added to each sample, mixed, and centrifuged at 15,000 rpm for 5 min. The supernatant was removed, and the radioactivity in the pellet was detected in a γ counter (9).
Apo-TC and Holo-TC
The level of Apo-TC in mouse serum was determined by measuring the unsaturated B12 binding capacity utilizing the assay described previously (10). A modified QUSO-based method (11) was used to determine the amount of B12 bound to TC. Microfine silica (QUSO G35) binds TC, and in our hands >98% of the TC in serum is removed bound to QUSO. Less than 2% of the HC is trapped in the QUSO pellet; this can be removed by washing the QUSO pellet, and the B12 bound to TC can be efficiently extracted and assayed. To measure B12 bound to TC as Holo-TC, 200 μl of serum was mixed with 400 μl QUSO G35 (concentration at 60 mg/ml in water); the QUSO was pelleted at 15,000 rpm for 5 min and washed once with 500 μl PBS. The QUSO pellet was suspended in 2 ml Cbl extraction buffer, extracted, and assayed as described above.
Analysis of metabolites in brain and spinal cord
Serum total HCY, defined as the total concentration of HCY following reductive cleavage of all disulfide bonds, was measured by liquid chromatography–electrospray ionization–tandem mass spectrometry (LC-ESI-MS/MS) as previously described (12). Brain tissue was processed using a modified technique to extract protein-bound HCY. Instead of precipitating the proteins with perchloric acid (PCA), the tissue was homogenized in 4 vol of 5 mM DTT and 10 μM 2H4-HCY and incubated on ice for 20 min. The homogenized samples were centrifuged at 14,000 rpm at 4°C for 10 min. Aqueous supernatant was transferred to a 10,000 MW cutoff filter unit and centrifuged at 14,000 rpm at 4°C for 25 min. The protein-free filtrate was analyzed for total HCY by LC-MS/MS (12). Serum MMA level was measured by LC-ESI-MS/MS as described previously (13).
Brain tissue MMA was determined by LC-MS/MS as described previously, with some modification (14). Preparation details of brain tissue samples are as follows. Calibration stock solution of MMA (1 mM) was diluted in type 1 water to perform a 5-point calibration curve (1.25–20 μM). Regional brain tissue (cortex, cerebellum, medulla, hippocampus, and spinal cord) samples that were previously deproteinized 1:5 with ice-cold 0.1 M PCA were thawed and spun. PCA extracts were prepared by the addition of 80 μl of water containing 0.1% formic and 5 μM d3-MMA internal standard to 20 μl of blank, standard, QC, or brain extract and mixed by vortex. The prepared sample was transferred to a 96-well microtiter plate, and 10 μl was injected for analysis into a Nexera LC system (Shimadzu, Kyoto, Japan) interfaced with a 5500 QTRAP (AB Sciex, Framingham, MA, USA).
The analysis of S-adenosyl methonine (SAM), S-adenosyl homocysteine (SAH), methionine, cystathionine, choline, and betaine in brain regions were performed using labstable-isotope dilution LC-ESI-MS/MS as described previously (15). For this analysis, brain tissue was deproteinized with 4 vol of 0.1 M PCA. After centrifugation, brain extracts were diluted 1:10 with the mobile phase solution A containing 5–25 μM labeled-isotope internal standards. Samples were injected into a Shimadzu Nexera LC System interfaced with a 5500 QTRAP LC-MS/MS (AB Sciex). All data were collected using Analyst 1.5.2 software. Statistical analysis was done using GraphPad Prism (GraphPad, San Diego, CA, USA). Statistical significance was determined by the Student's t test using unpaired and nonparametric analysis.
RESULTS
TCblR and megalin mRNA expression in embryos
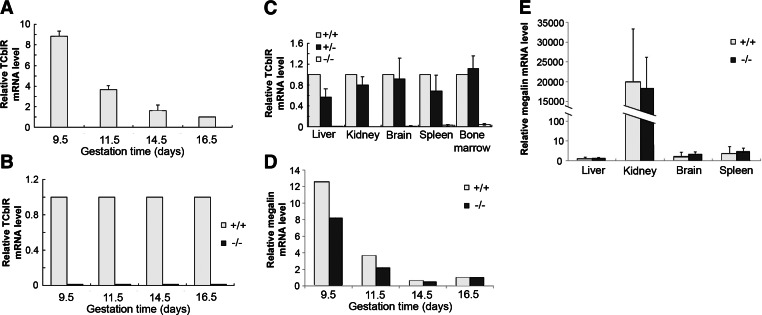
The TCblR-KO mice reproduced normally, although smaller litters averaging just 2–4 pups were born to third- and fourth-generation nullizygous dams compared to WT, which produced 6 to 10 pups. The expression of mRNA level was highest at gestation day (GD) 9.5 and dropped 40–50% between GD 14.5 and 16.5 in the WT embryos (Fig. 1A), while embryos from homozygous KO mice showed no expression of the TCblR mRNA at all time points examined (Fig. 1B). In tissues harvested from 4- to 6-mo adult mice, TCblR mRNA was not detectable in the nullizygous mice, while tissues from both WT and heterozygous mice showed TCblR mRNA that was comparably expressed (Fig. 1C). Megalin expression in both WT and KO pups was similar, with highest expression in early embryos (Fig. 1D). This similarity was also seen in adult mouse tissues, but the expression in the kidney was very high compared to other tissues (Fig. 1E).
Figure 1.
TCblR and megalin expression in WT (+/+) and KO (−/−) mice during embryonic development and in adult tissues, determined by qPCR. A) Relative mRNA levels in WT embryo were normalized to the expression in GD16 embryos. B) TCblR mRNA expression in KO embryos compared to WT. Values are means for 2 embryos analyzed in triplicate for each time point. C) Relative mRNA level in adult mouse tissues. D, E) Megalin mRNA in embryos, normalized to GD16 expression (D), and in adult mouse tissues, relative to the expression in the liver (E). Data represent means ± se, n = 4/genotype.
Total Cbl in tissues
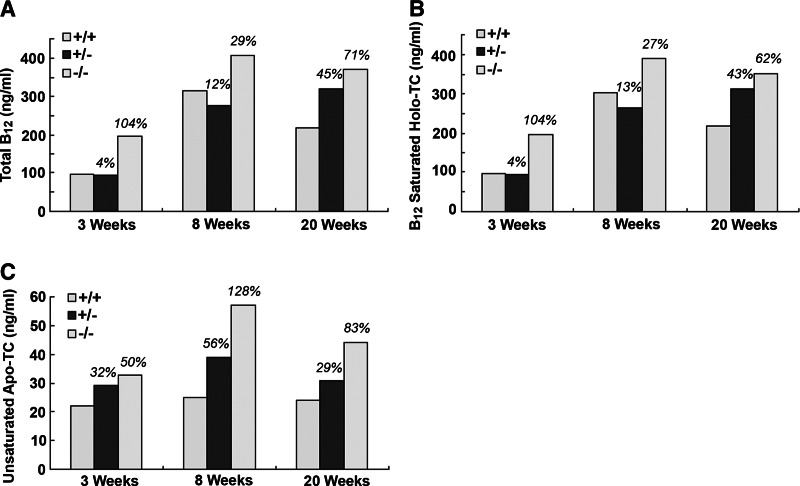
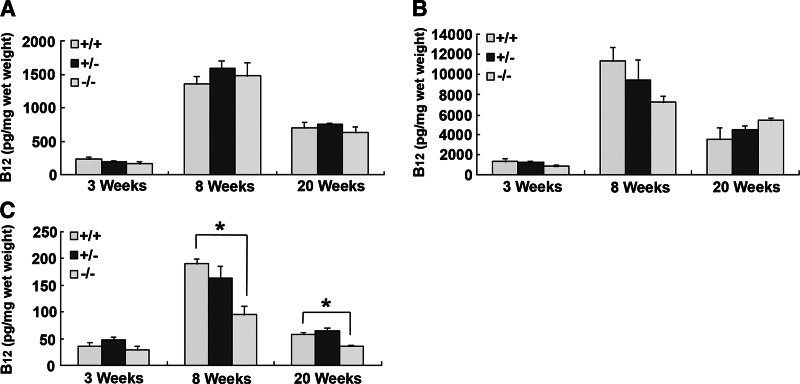
Serum Cbl determined at 3, 8, and 20 wk of age showed a moderate increase in total B12 in CD320 nullizygous mice at all 3 time points (Fig. 2A). The result was obtained from serum pooled from 6 mice to allow for other analyses in the same sample, and therefore no sd is provided. These results are consistent with the values obtained for holo TC (Fig. 2B) and apo TC (Fig. 2C) that also showed a similar trend. However, serum HCY (1.6- and 1.2-fold) and MMA (2.9- and 4.9-fold) were elevated in KO mice at 20 and 52 wk, even though serum B12 concentrations were normal (Fig. 3). Hematologic parameters determined in 52- to 76-wk-old mice showed no indication of anemia in the KO mice, and the only abnormality observed was a ∼50% decrease in white cell count in the older CD320-null mice (Table 1). Total B12 concentrations in the liver, kidney, and spleen showed a dramatic increase at 8 wk, which decreased to levels seen in adult mice at 20 wk. However, there was no decrease in B12 content of the liver and kidney in the nullizygous KO mice (Fig. 4A, B). In contrast, a small but significant decrease in B12 content was observed in the spleen at 8 and 20 wk in the KO mice (Fig. 4C). The most dramatic and significant decrease (P<0.01) in B12 content was observed in the brain, showing an 85% decrease in Cbl in KO (14 pg/mg wet weight) at 3 wk, which was further decreased at 8 and 20 wk (6 and 4 pg/mg wet weight, respectively) (Fig. 5A). A similar decrease was seen in the spinal cord of adult mice (KO: 8 pg/mg wet weight vs. WT: 134 pg/mg wet weight; Fig. 5B).
Figure 2.
Total B12 and transcobalamin in mouse serum. Total B12 (A), B12-saturated Holo TC (B), and unsaturated apo TC (C) were measured at 3, 8, and 20 wk of age. For each genotype, serum from 6 mice was pooled for a single analysis. Number above each bar indicates percentage increase or decrease compared to WT.
Figure 3.
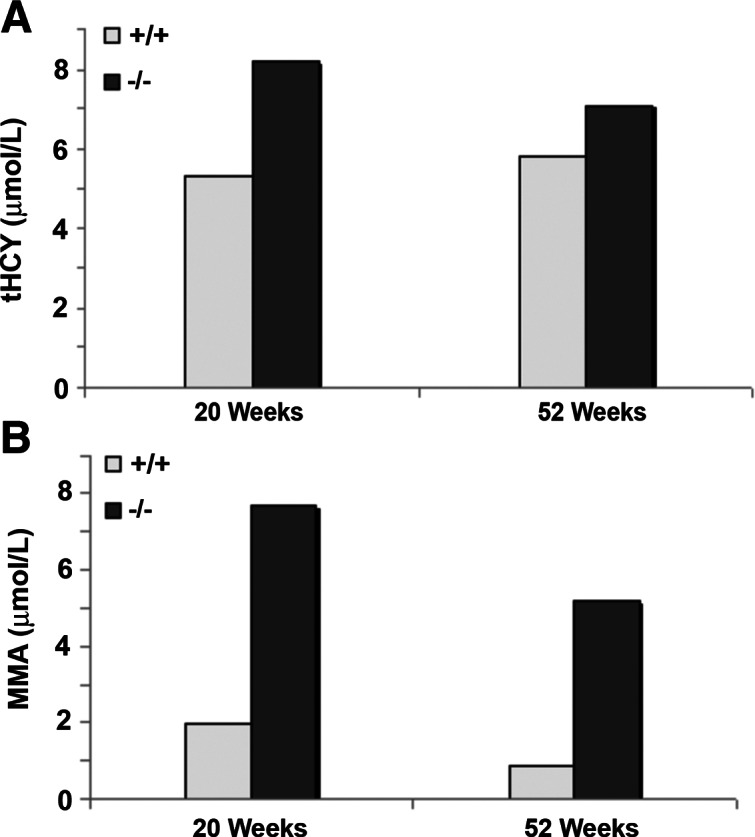
Total homocysteine (HCY) and methylmalonic acid (MMA) levels in serum. HCY (A) and MMA (B) levels in mouse serum were measured at 20 and 52 wk. Serum samples of WT and KO mice were pooled from 3 mice. Data represent single analysis in an aliquot of the pooled serums.
Table 1.
Complete blood count analysis
| Parameter | WT-1Y, n = 5 | KO-1Y, n = 5 | WT-1.5Y, n = 3 | KO-1.5Y, n = 3 |
|---|---|---|---|---|
| WBC (109/L) | 7.7 ± 1.4 | 9.7 ± 1.9 | 9.6 ± 1.2 | 4.5 ± 0.5 |
| RBC (1012/L) | 9.6 ± 0.7 | 9.3 ± 0.6 | 7.5 ± 0.8 | 8.2 ± 0.3 |
| HGB (g/dl) | 13.1 ± 0.5 | 12.9 ± 1.2 | 11.9 ± 2.6 | 12.7 ± 0.5 |
| HCT (% total vol) | 50.9 ± 1.5 | 51.5 ± 5.0 | 40.8 ± 8.0 | 43.1 ± 3.3 |
| MCV (fl) | 53.8 ± 2.5 | 55.6 ± 3.3 | 48.7 ± 0.6 | 49.3 ± 1.9 |
| MCH (pg) | 13.8 ± 0.5 | 13.9 ± 0.1 | 14.2 ± 0.9 | 14.6 ± 0.4 |
| MCHC (g/dl) | 25.7 ± 0.5 | 25.1 ± 0.3 | 29.1 ± 1.6 | 29.6 ± 1.2 |
| RDW (μm) | 13.5 ± 1.6 | 13.1 ± 0.6 | 14.6 ± 4.2 | 12.4 ± 0.5 |
| Plat (103/μl) | 774.3 ± 169.8 | 960.3 ± 75.3 | 568.9 ± 384.8 | 888.9 ± 127.9 |
| MPV (fl) | 8.1 ± 0.1 | 7.8 ± 1.9 | 7.1 ± 0.4 | 6.2 ± 0.3 |
Data represent means ± sd. WBC, white blood cell count; RBC, red blood cell count; HGB, hemoglobin; HCT, hematocrit; MCV, mean corpuscular volume; MCH, mean corpuscular hemoglobin; MCHC, mean corpuscular hemoglobin concentration; RDW, RBC distribution width; Plat, platelet count; MPV, mean platelet volume.
Figure 4.
Total B12 level in mouse tissues. B12 level of liver (A), kidney (B), and spleen (C) was measured at 3, 8, and 20 wk of age. Six mice from each WT (+/+) and KO (−/−) group were sacrificed to obtain tissues. Data represent means ± se. *P < 0.01.
Figure 5.
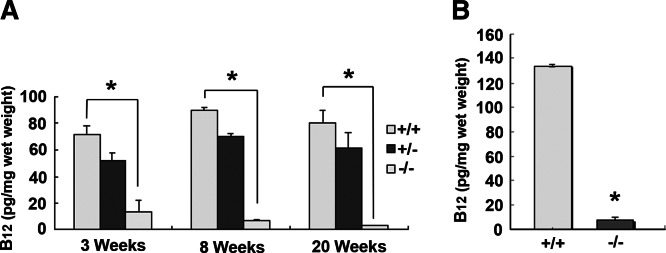
Total B12 levels in mouse CNS tissues. A) B12 level in brain was measured at age of 3, 8, and 20 wk. Six mice from each genotype were sacrificed to obtain tissues. B) B12 level of spinal cord was measured at age of 10 mo from 4 mice of each WT (+/+) and KO (−/−) group. Data represent means ± se. *P < 0.01.
Metabolite analysis in the CNS
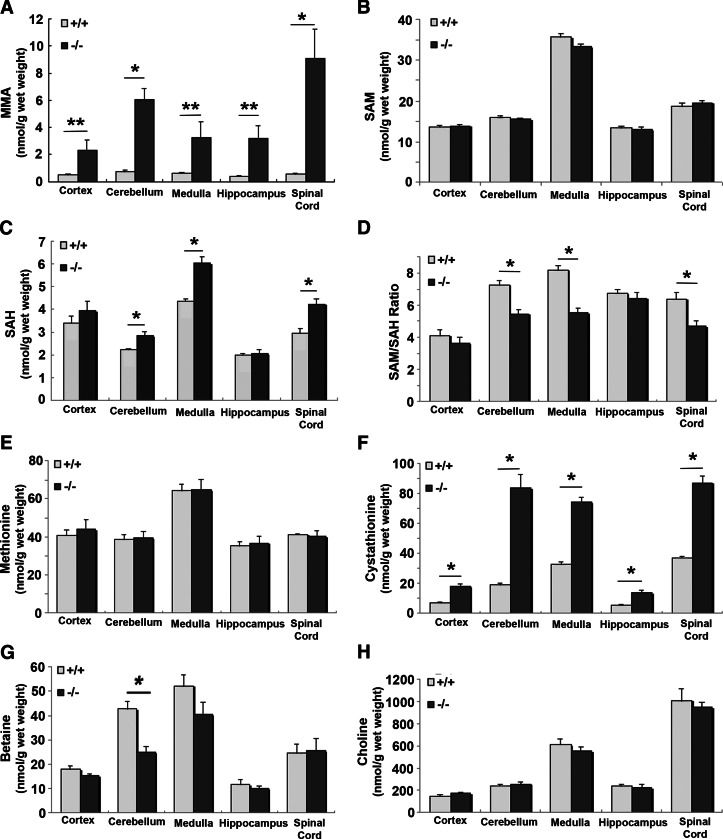
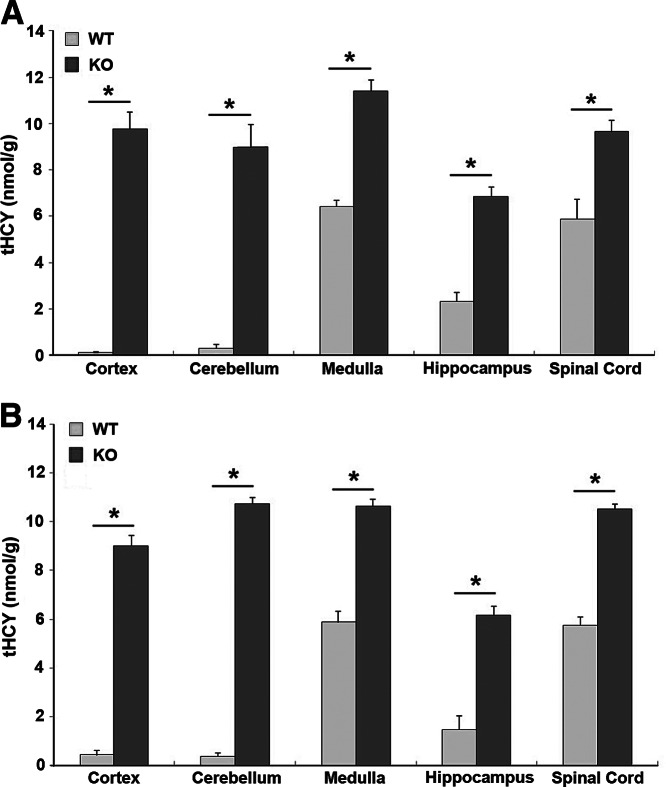
Significant increase in MMA (P<0.01–0.04) was observed in all regions of the brain in the KO mice, with highest levels in the cerebellum and in the spinal cord (Fig. 6A). There was highly significant accumulation of cystathionine (P<0.01) in all regions of the brain in the KO mice, especially in the cerebellum and the spinal cord (Fig. 6F). While methionine and SAM levels were similar in WT and KO CNS, the level of SAH was significantly increased, and the SAM/SAH ratio was significantly decreased in the medulla, cerebellum, and spinal cord but remained unaltered in the cortex and hippocampus (Fig. 6B–E). Two other metabolites, betaine and choline, were not significantly altered in the CNS, with the exception of a significant decrease in the betaine content of the cerebellum (Fig. 6G, H). Homocysteine was not detected in these samples because PCA was used to deproteinize the samples and that necessitated a large dilution of the extract for the HPLC procedure. Fresh brain tissue was collected from 12- and 24-wk-old mice and analyzed by processing without PCA to obtain HCY levels in different regions of the brain. HCY was significantly elevated in all regions of the brain in the KO mice. In the WT mice, the regional distribution of HCY showed higher levels in the medulla, hippocampus, and the spinal cord compared to the cortex and cerebellum (Fig. 7).
Figure 6.
Analysis of metabolites in CNS tissues. Levels of MMA (A), SAM (B), SAH (C), SAM/SAH ratio (D), methionine (E), cystathionine (F), betaine (G), and choline (H) were obtained from 5 WT and 5 KO mice. The whole brain was removed and separated into cortex, cerebellum, medulla, and hippocampus by microdissection. Spinal cord was collected from the same animals. Data represent means ± se. *P < 0.01, **P < 0.04.
Figure 7.
Regional distribution of homocysteine in mouse brain. Homocysteine in WT and KO mice was determined at 3 mo (A) and 6 mo (B). At both time periods, the regional distribution of HCY appears to be similar with significantly elevated levels in all regions of the KO mouse brain.
DISCUSSION
The identification of the receptor for cellular uptake of TC-bound Cbl enabled us to produce the gene KO model with which to study the effects of this gene ablation on Cbl metabolism and other metabolic pathways (7). The fact that the TCblR/CD320 KO was not embryonically lethal suggested to us that either the nutrient is not critical during this stage of development, or an alternate pathway must exist to provide adequate Cbl to the developing fetus. Megalin, a multiligand receptor, is highly expressed on epithelial cells during embryonic and fetal development (16, 17), and our results support this conclusion. Megalin does bind TC-Cbl and could act as a surrogate receptor in the absence of TCblR. This receptor provides an alternate route for many of the ligands that bind to it, and therefore, the megalin KO is an embryo-lethal mutation (18). In human congenital TC deficiency, fetal development is normal and the conceptus is carried to term (19). This raises the possibility that haptocorrin bound Cbl may be available to the fetus by a yet unknown mechanism. The mouse, on the other hand, has a single Cbl binding protein in the blood that is structurally and functionally similar to human TC (20). All of the circulating Cbl is carried by this protein, which is only partially saturated with Cbl and, therefore, only TC can deliver Cbl to the embryo. The absence of systemic Cbl deficiency in this model is consistent with the daily dietary intake of Cbl and an intact pathway for Cbl absorption in the gut. The normal accumulation of Cbl in the liver and kidney in the KO would suggest that a separate mechanism must exist for the uptake of Cbl in these organs. In the kidney, the highly expressed megalin could account for the Cbl retention observed. However, similar accumulation in the liver is difficult to explain because there is very little, if any, megalin expression. Cbl uptake in human liver is attributed to the uptake of desialated haptocorrin-bound Cbl by the asialoglycoprotein receptor (20). The total lack of haptocorrin in the mouse precludes this mechanism (21). This opens up the possibility that in the mouse liver TC-Cbl is taken up. However, since murine TC is not a glycoprotein, the asialoglycoprotein receptor mechanism is an unlikely option. The accumulation of Cbl in the liver of the KO mouse remains unexplained, and uptake of TC-Cbl by a yet to be identified mechanism is a distinct possibility. The lack of systemic Cbl deficiency with no evidence of anemia may be related to the concentration of B12 (50 μg/kg) and folic acid (7.5 mg/kg) in the diet. Similarly, the normal values for SAM and choline may be due to an abundance of methionine (6.7 g/kg) and choline (2.25 g/kg) in the chow. Dietary restriction studies may provide some insight into the role of CD 320 in metabolic pathways utilizing these nutrients.
The dramatic loss of Cbl in the CNS is compelling evidence of a single mechanism utilizing the TCblR for TC-Cbl uptake. The nutrient deficiency in the brain is amply demonstrated by alterations in the concentrations of metabolites such as increased HCY and MMA and the decreased SAM/SAH ratio. The altered SAM/SAH ratio suggests disruption of Cbl/folate pathways that could affect methylation status. This is further supported by the global hypomethylation of DNA observed in the brains of these mice (22). The significance of differences in the levels of HCY in some regions of the brain in the WT is not clear, but the elevated HCY in all regions of the brain in the KO is consistent with Cbl deficiency. In the absence of systemic Cbl deficiency, the elevated serum HCY and MMA in KO mice likely derives from that produced in the CNS. The high accumulation of cystathionine in the brain is consistent with what is known about the HCY processing pathways in the brain. CBS is expressed in all regions of the brain. It is developmentally regulated and shows regional over expression in the adult mouse brain (23, 24). Studies in rat brain show that CBS activity in most regions of the brain is at least 10-fold higher compared to cystathionase, and this difference is more pronounced in the cerebellum (25). This difference may also apply to mouse brain and account for the high cystathionine observed in Cbl deficient mouse brain. An active brain cystathionine β synthase pathway readily converts HCY that is not shunted out of the brain into cystathionine. In the second step in this pathway is the cystathionine gamma lyase, which is much lower in the brain and therefore, when homocysteine increases, cystathionine accumulates in the brain. The pathological consequences of this accumulation are yet to be identified. The CD320 gene KO provides a model to study the consequences of Cbl deficiency in the CNS and raises a number of other questions concerning Cbl homeostasis, such as Cbl accumulation in the liver and kidney and transplacental transport and fetal delivery of this essential nutrient. The selective depletion of Cbl in the CNS provides for the first time, an animal model to evaluate the consequences of Cbl depletion in the CNS, since the metabolic basis for the CNS pathology in humans with Cbl deficiency still remains undefined. It is likely that the KO mouse may not show the structural and functional abnormalities seen in the human Cbl deficiency, but the metabolic changes observed thus far are typical for Cbl deficiency, and therefore the CD320 gene KO mouse provides an animal model of Cbl deficiency in the CNS that could prove useful to identify pathways and genes involved.
Acknowledgments
This work was supported by U.S. National Institutes of Health grants DK064732 (E.V.Q.) and HD067244 (R.H.F.).
The authors are most thankful to Dr. Erland Arning for his contributions to the analysis of metabolites.
Footnotes
- 5MTHF
- 5-methyltetrahydrofolate
- Cbl
- cobalamin
- CNS
- central nervous system
- ES
- embryonic stem
- GD
- gestation day
- HCY
- homocysteine
- KO
- knockout
- LC-ESI-MS/MS
- liquid chromatography–electrospray ionization–tandem mass spectrometry
- MMA
- methylmalonic acid
- PCA
- perchloric acid
- SAH
- S-adenosyl homocysteine
- SAM
- S-adenosyl methonine
- TC
- transcobalamin
- TCblR
- transcobalamin receptor
- WT
- wild type
REFERENCES
- 1. Quadros E. V. (2010) Advances in the understanding of cobalamin assimilation and metabolism. Br. J. Haematol. 148, 195–204 [DOI] [PMC free article] [PubMed] [Google Scholar]
- 2. Lindenbaum J., Healton E. B., Savage D. G., Brust J. C., Garrett T. J., Podell E. R., Marcell P. D., Stabler S. P., Allen R. H. (1988) Neuropsychiatric disorders caused by cobalamin deficiency in the absence of anemia or macrocytosis. N. Engl. J. Med. 318, 1720–1728 [DOI] [PubMed] [Google Scholar]
- 3. Chanarin I., Deacon R., Lumb M., Muir M., Perry J. (1985) Cobalamin-folate interrelations: a critical review. Blood 66, 479–489 [PubMed] [Google Scholar]
- 4. Cannata J. J., Focesi A., Jr., Mazumder R., Warner R. C., Ochoa S. Metabolism of propionic acid in animal tissues. XII. Properties of mammalian methylmalonyl coenzyme A mutase. J. Biol. Chem. 240, 3249–3257 [PubMed] [Google Scholar]
- 5. Oh R., Brown D. L. (2003) Vitamin B12 deficiency. Am. Fam. Physician 67, 979–986 [PubMed] [Google Scholar]
- 6. Allen R. H., Stabler S. P., Savage D. G., Lindenbaum J. (1993) Metabolic abnormalities in cobalamin (vitamin B12) and folate deficiency. FASEB J. 7, 1344–1353 [DOI] [PubMed] [Google Scholar]
- 7. Quadros E. V., Nakayama Y., Sequeira J. M. (2009) The protein and the gene encoding the receptor for the cellular uptake of transcobalamin-bound cobalamin. Blood 113, 186–192 [DOI] [PMC free article] [PubMed] [Google Scholar]
- 8. Stanford W. L., Cohn J. B., Cordes S. P. (2001) Gene-trap mutagenesis: past, present and beyond. Nat. Rev. Genet. 2, 756–768 [DOI] [PubMed] [Google Scholar]
- 9. Quadros E. V. (2000) Vitamin B12. In Modern Analytical Methodologies in Fat- and Water-Soluble Vitamins, Vol. 154 (Song W. O., Beecher R., Eitenmiller R. R., eds) pp. 313–328, John Wiley & Sons, New York [Google Scholar]
- 10. Rothenberg S. P., Quadros E. V., (1997) Quantitative methods for measurement of transcobalamin II. Methods Enzymol. 281, 261–268 [DOI] [PubMed] [Google Scholar]
- 11. Jacob E., Herbert V. (1975) Measurement of unsaturated “granulocyte-related” (TC I and TC III) and “liver-related” (TC II) B12 binders by instant batch separation using a microfine precipitate of silica (QUSO G32). J. Lab. Clin. Med. 86, 505–512 [PubMed] [Google Scholar]
- 12. Ducros V., Belva-Besnet H., Casetta B., Favier A. (2006) A robust liquid chromatography tandem mass spectrometry method for total plasma homocysteine determination in clinical practice. Clin. Chem. Lab. Med. 44, 987–990 [DOI] [PubMed] [Google Scholar]
- 13. Yuan C., Gabler J., El-Khoury J. M., Spatholt R., Wang S. (2010) Highly sensitive and selective measurement of underivatized methylmalonic acid in serum and plasma by liquid chromatography-tandem mass spectrometry. Anal. Bioanal. Chem. 404, 133–140 [DOI] [PubMed] [Google Scholar]
- 14. Fasching C., Singh J. (2010) Quantitation of methylmalonic acid in plasma using liquid chromatography-tandem mass spectrometry. Methods Mol. Biol. 603, 371–378 [DOI] [PubMed] [Google Scholar]
- 15. Inoue-Choi M., Nelson H. H., Robien K., Arning E., Bottiglieri T., Koh W. P., Yuan J. M. (2012) One-carbon metabolism nutrient status and plasma S-adenosylmethionine concentrations in middle-aged and older Chinese in Singapore. Int. J. Mol. Epidemiol. Genet. 3, 160–173 [PMC free article] [PubMed] [Google Scholar]
- 16. Verroust P. J., Christensen E. I. (2002) Megalin and cubilin—the story of two multipurpose receptors unfolds. Nephrol. Dial. Transplant. 17, 1867–1871 [DOI] [PubMed] [Google Scholar]
- 17. Willnow T. E., Hilpert J., Armstrong S. A., Rohlmann A., Hammer R. E., Burns D. K., Herz J. (1996) Defective forebrain development in mice lacking gp330/megalin. Proc. Natl. Acad. Sci. U. S. A. 93, 8460–8464 [DOI] [PMC free article] [PubMed] [Google Scholar]
- 18. Leheste J. R., Rolinski B., Vorum H., Hilpert J., Nykjaer A., Jacobsen C., Aucouturier P., Moskaug J. O., Otto A., Christensen E. I., Willnow T. E. (1999) Megalin knockout mice as an animal model of low molecular weight proteinuria. Am. J. Pathol. 155, 1361–1370 [DOI] [PMC free article] [PubMed] [Google Scholar]
- 19. Cooper B. A., Rosenblatt D. S. (1987) Inherited defects of vitamin B12 metabolism. Annu. Rev. Nutr. 7, 291–320 [DOI] [PubMed] [Google Scholar]
- 20. Lindemans J., de Jongh E. J., Brand F. C., Schoester M., Van Kapel J., Abels J. (1982) The uptake of R-type cobalamin-binding protein by isolated rat liver cells. Biochim. Biophys. Acta 720, 203–210 [DOI] [PubMed] [Google Scholar]
- 21. Hygum K., Lildballe D. L., Greibe E. H., Morkbak A. L., Poulsen S. S., Sorensen B. S., Petersen T. E., Nexo E. (2011) Mouse transcobalamin has features resembling both human transcobalamin and haptocorrin. PLoS ONE 6, e20638. [DOI] [PMC free article] [PubMed] [Google Scholar]
- 22. Fernàndez-Roig S., Lai S.-C., Murphy M.M., Fernandez-Ballart J., Quadros E.V. (2012) Vitamin B12 deficiency in the brain leads to DNA hypomethylation in the TCblR/CD320 knockout mouse. Nutr. Metab. (Lond.) 9, 41. [DOI] [PMC free article] [PubMed] [Google Scholar]
- 23. Robert K., Vialard F., Thiery E., Toyama K., Sinet P. M., Janel N., London J. (2003) Expression of the cystathionine beta synthase (CBS) gene during mouse development and immunolocalization in adult brain. J. Histochem. Cytochem. 51, 363–371 [DOI] [PubMed] [Google Scholar]
- 24. Enokido Y., Suzuki E., Iwasawa K., Namekata K., Okazawa H., Kimura H. (2005) Cystathionine beta-synthase, a key enzyme for homocysteine metabolism, is preferentially expressed in the radial glia/astrocyte lineage of developing mouse CNS. FASEB J. 19, 1854–1856 [DOI] [PubMed] [Google Scholar]
- 25. Awata S., Nakayama K., Suzuki I., Sugahara K., Kodama H. (1995) Changes in cystathionine gamma-lyase in various regions of rat brain during development. Biochem. Mol. Biol. Int. 35, 1331–1338 [PubMed] [Google Scholar]


