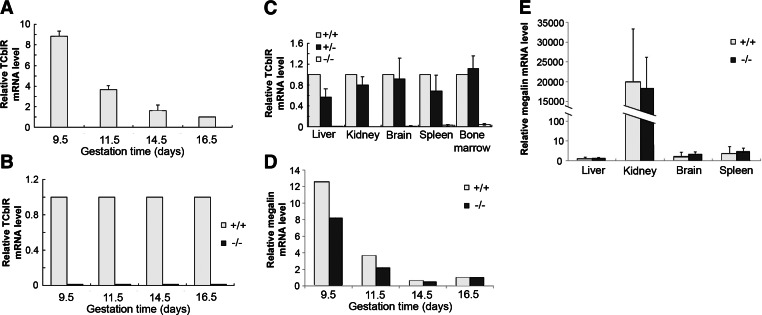
Figure 1.
TCblR and megalin expression in WT (+/+) and KO (−/−) mice during embryonic development and in adult tissues, determined by qPCR. A) Relative mRNA levels in WT embryo were normalized to the expression in GD16 embryos. B) TCblR mRNA expression in KO embryos compared to WT. Values are means for 2 embryos analyzed in triplicate for each time point. C) Relative mRNA level in adult mouse tissues. D, E) Megalin mRNA in embryos, normalized to GD16 expression (D), and in adult mouse tissues, relative to the expression in the liver (E). Data represent means ± se, n = 4/genotype.

