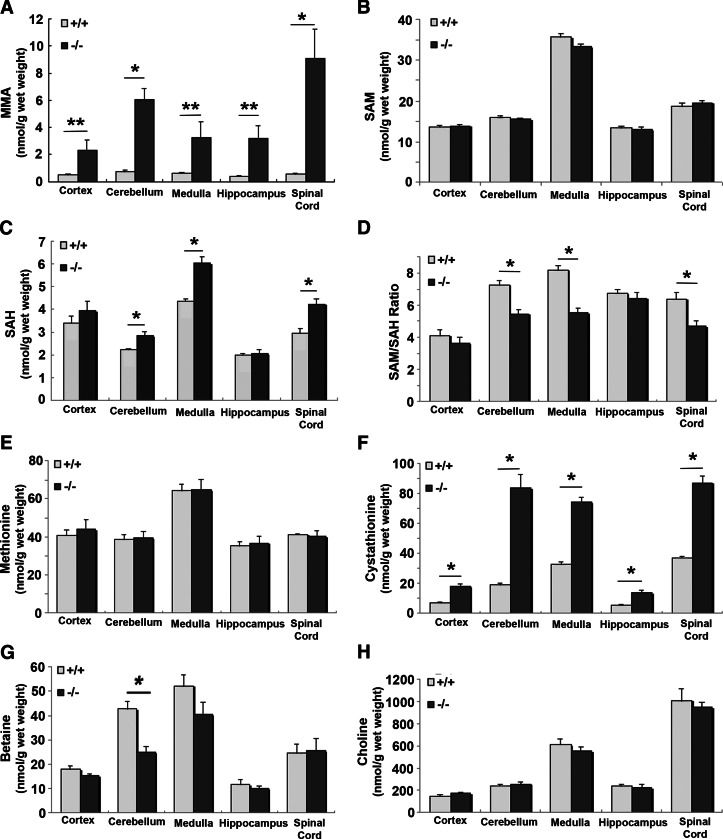
Figure 6.
Analysis of metabolites in CNS tissues. Levels of MMA (A), SAM (B), SAH (C), SAM/SAH ratio (D), methionine (E), cystathionine (F), betaine (G), and choline (H) were obtained from 5 WT and 5 KO mice. The whole brain was removed and separated into cortex, cerebellum, medulla, and hippocampus by microdissection. Spinal cord was collected from the same animals. Data represent means ± se. *P < 0.01, **P < 0.04.

