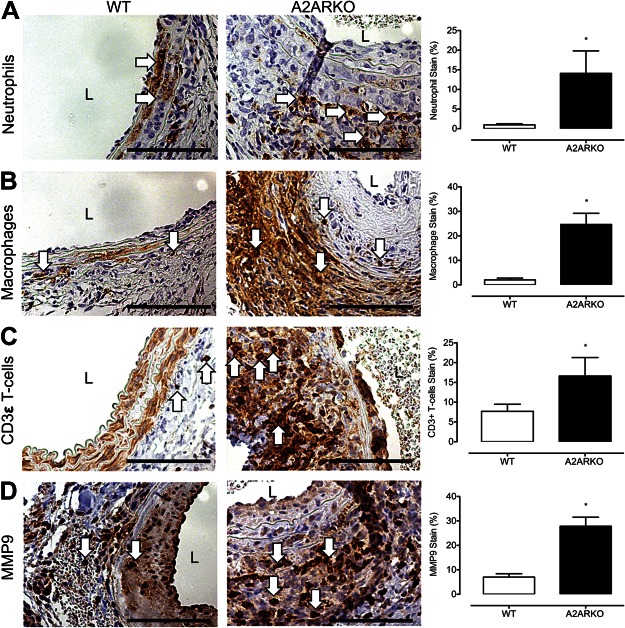
Figure 2.
A2AR gene deletion leads to increased inflammatory cell infiltration and greater matrix degradation. Representative cross-sectional photomicrographs from WT and A2ARKO abdominal aneurysms at d 14 after elastase perfusion. Immunohistochemical staining at ×40 magnification identifies neutrophils (A), macrophages (B), CD3ε T lymphocytes (C), and MMP9 (D) following elastase perfusion on d 14 in the medial and adventitial layers, indicated by arrows. Threshold-gated image quantification of DAB signal in AOI isolated to medial and adventitial layer of aorta. Immunostaining signal quantification was normalized to the total AOI background signal. WT: n = 4; A2ARKO: n = 4. L, lumen. *P < 0.05.

