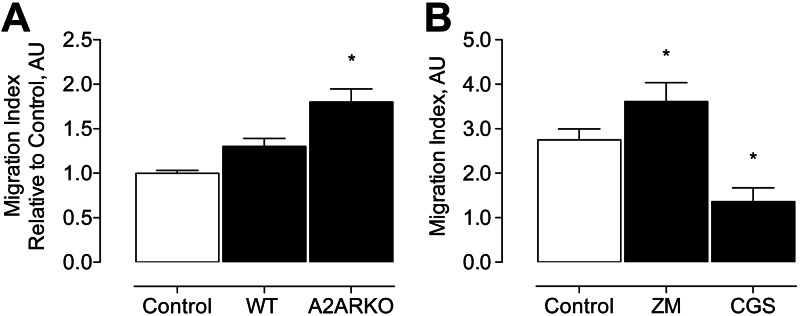
Figure 5.

In vitro studies examining CCL2-dependent CD4+ T-lymphocyte chemotaxis. A) CCL2-induced chemotaxis of CD4+/CD28+/CD137+ T lymphocytes from WT and A2ARKO mice; n = 3/group. B) CCL2-induced chemotaxis of CD4+/CD28+/CD137+ T lymphocytes from WT mice treated with A2AR antagonist (ZM) or A2AR agonist (CGS); n = 3/group. Open bars indicate chemotaxis of untreated control WT cells; solid bars indicate chemotaxis of treated WT cells. *P < 0.05.
