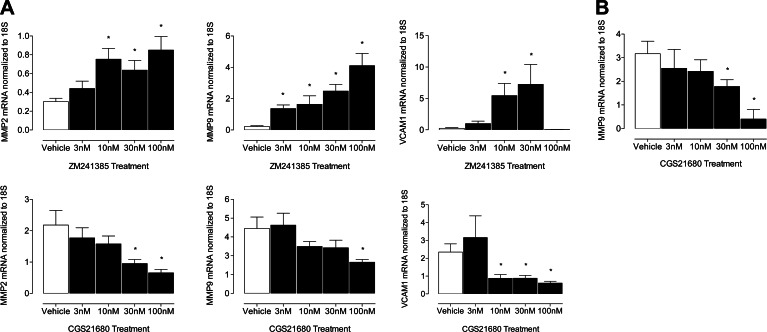
Figure 6.
Gene expression of MMP2, MMP9, and VCAM1 is modulated by A2AR. A) Top panels: ZM241385-treated SMCs from WT mice. Bottom panels: CGS21680-treated SMCs from WT mice. Data are normalized to 18S mRNA transcript levels and represent relative fold change in treated WT cells. B) CGS21680-treated CD4+/CD28+/CD137+ T lymphocytes from WT mice. Open bars indicate vehicle-treated WT cells; solid bars indicate dose-dependent treatment of cells; n = 6/group. *P < 0.05.

