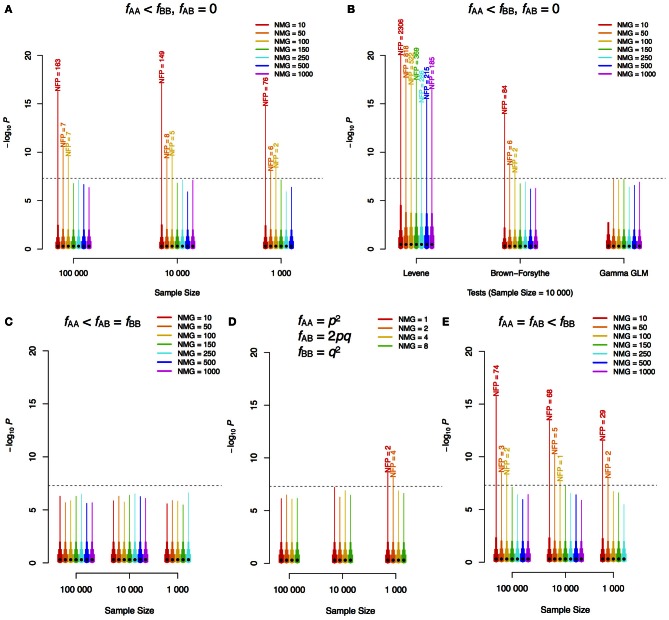
Figure 1.
–log10P-value distribution for different scenarios of GWAS for phenotypic variability. Different sample sizes (n) and numbers of individuals in the minor genotype class (NMG = nfAA) were simulated. 1,000,000 replicates for each combination of n and NMG were performed with phenotypes simulated as white noise from a standard normal distribution (i.e., no genetic effects). The same method as that employed by (Yang et al., 2012), regression using the squared Z-scores, was used in the analyses of (A,C–E). Two genotype classes were simulated in (A) and (B), and three were simulated in (C) (one minor class), (D) (Hardy–Weinberg equilibrium) and (E) (two minor classes). The dashed horizontal lines show the Bonferroni corrected threshold for 1,000,000 tests. The black dot on each bar indicates the median of the 1,000,000 scores, and the top ends of the bars with different widths indicate 85, 95, 99, and 100% (maximum) quantiles of the scores. The labels on top of the bars are the corresponding numbers of false positives (NFP) above the threshold. f, frequency; p, minor allele frequency; q, 1–p; GLM, generalized linear model.

