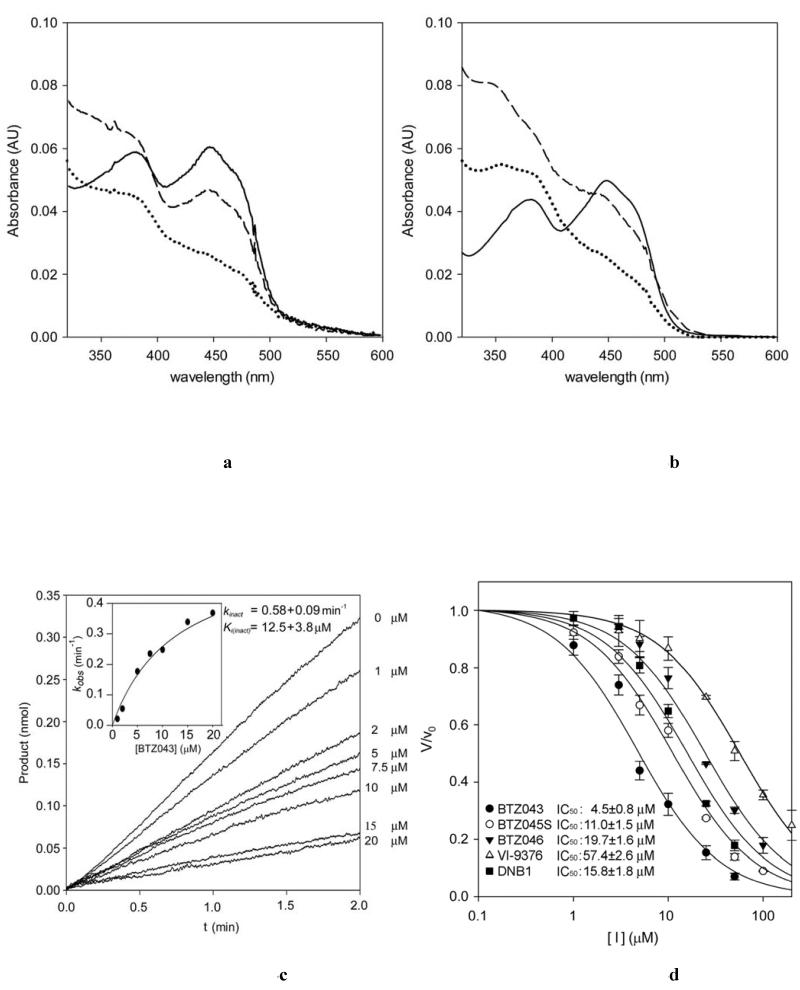
Fig. 4.
DprE1 inhibition by BTZs, DNB1 and VI-9376. (A) UV/Vis absorbance spectrum showing the anaerobic DprE1 flavin re-oxidation carried out by menaquinone. Continuous, dotted and dashed lines correspond to oxidized, photoreduced and BTZ043-reoxidized DprE1, respectively. (B) UV/Vis absorbance spectrum showing the anaerobic DprE1 flavin re-oxidation carried out by BTZ043. Continuous, dotted and dashed lines correspond to oxidized, photoreduced and BTZ043-reoxidized DprE1, respectively. (C) Steady-state progress curves obtained for the inactivation of DprE1 by BTZ043 at different concentrations (reported on the right of each curve) using the peroxidase/Amplex Red coupled assay. The standard reaction mixture contained 20 mM glycylglycine pH 8.5, 150 μM FPR, 0.3μM DprE1, 50 μM Amplex Red, 0.35 μM horseradish peroxidase and the assay was performed at 37°C. Progress curves were fit to the single exponential equation for slow-binding inhibitors: product = v0[1 − exp(-kobst)]/kobs, where v0 is the initial velocity for each curve. The kobs values were then analyzed by the method of Kitz and Wilson to yield kinact and Ki(inact)(see inset) (41). (D) DprE1 initial velocities measured by the DCPIP assay plotted versus inhibitor concentration. In each measurement the protein sample (3 μM) was incubated with 100 μM FPR and variable concentrations of the inhibitor (0-50 or 0-200μM depending on the inhibitor). The IC50 values were determined by fitting the data as described in the online methods. (E) Mechanism of DprE1 inhibition by BTZ043.


