
Fig. 1.
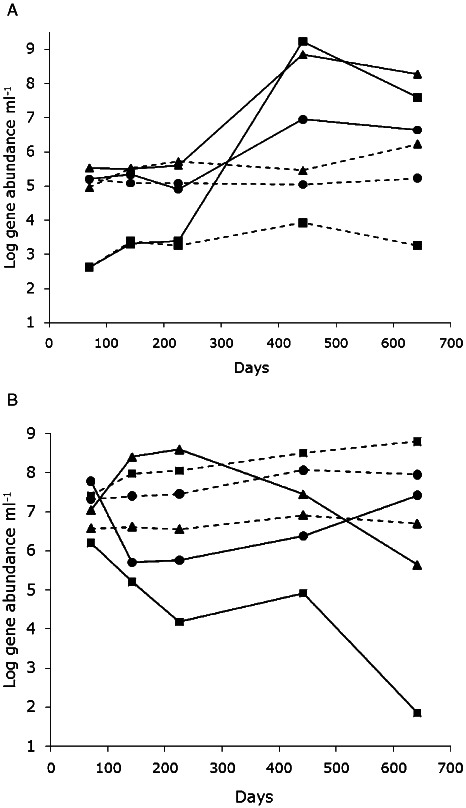
(A) Abundance of syntrophic acetate-oxidizing bacteria in the control reactor (- - -) and the experimental reactor (—), as determined by qPCR analysis of 16S rRNA genes. C. ultunense•; S. schinkii▴; T. acetatoxydans . (B) Abundance of methanogens in the control reactor (- - -) and the experimental reactor (—) as determined by qPCR analysis of 16S rRNA genes. Methanomicrobiales•; Methanosarcinaceae▴; Methanosaetaceae
 . Genomic DNA was extracted from three replicate samples (0.3 ml each) from each reactor and sampling point, using the FastDNA Spin kit for soil (Qbiogene, Illkrich, France). The triplicate DNA samples were pooled and the qPCR was performed with a BioRad iCycler (Hercules, CA). Each reaction contained 3 μl DNA template, 1 μl of each primer (10 pmol μl−1), 5 μl of sterile water, 10 μl iQ Supermix PCR reagent (BioRad, Hercules, CA), and SYBR-Green I as the fluorescent DNA intercalating agent (0.2 μl of 100x concentrate, Invitrogen, UK). In qPCR analysis of the methanogenic communities the temperature cycle consisted of: 95°C for 7 min; 55 cycles of 95°C for 40 s; annealing at specific temperatures (Table S1) for 1 min; and 72°C for 40 s. qPCR analysis of SAOB was performed applying the following conditions: 7 min at 95°C; 40 cycles of 95°C for 30 s; annealing at specific temperatures (Table S1) for 1 min; and 72°C for 30 s. At the end of each qPCR assay, a temperature melt curve was performed to verify reaction quality (55–95°C, ΔT = 0.1°C s−1). Logarithmic values of the concentration of the16S rRNA gene were plotted against the threshold cycle (Ct) number and used for estimation of gene abundance in the unknown samples.