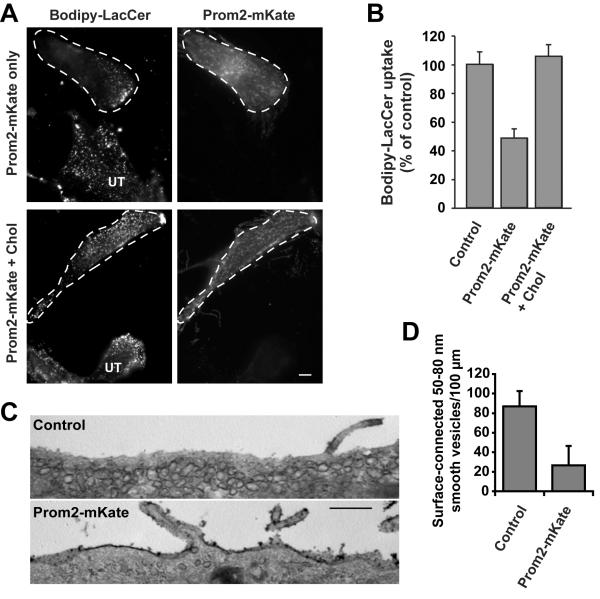
Fig. 2. Expression of Prom2 reduced caveolar endocytosis and the numbers of cell-surface attached caveolae.
(A) HSFs transfected ± Prom2-mKate (48 h) were assayed for Bodipy-LacCer endocytosis as described [27]. Transfected cells are outlined with dashed lines (UT-untransfected cells). Bar, 10 μm. (B) HSFs transfected ± Prom2-mKate were quantified for Bodipy-LacCer endocytosis by image analysis. One set of Prom2-expressing cells were pre-treated with 5 mM MßCD/Chol for 30 min at 37°C before Bodipy-LacCer endocytosis. Values are expressed as percentage of control (non-transfected cells in the same field) and are mean ± SE (n>30 cells from three independent experiments). (C) HSFs, transfected with Prom2-mKate or mKate alone (controls), were cultured on gridded glass cover slips for 48 h. Transfected cells (identified by fluorescence microscopy), were stained and processed by TEM to identify PM connected caveolae. Bar, 500 nm. (D) Ruthenium-red positive smooth vesicles (50–80 nm diameters) in TEM images were counted blindly. Values are expressed as means ± SE number/100 μm of length (n>20 cells/condition from two different experiments).

