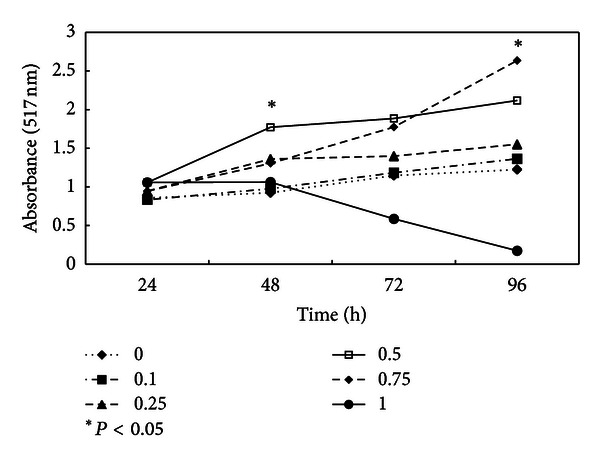
Figure 2.

Cell proliferation assay. After the treatment with different (0, 0.1, 0.25, 0.5, 0.75, and 1.0 mg/mL) concentration of HE, increase in total viable cells numbers was counted through MTT dye reduction assay. Cells were counted at different time intervals of 24, 48, 72, and 96 h. Values represent the mean of three independent experiments.
