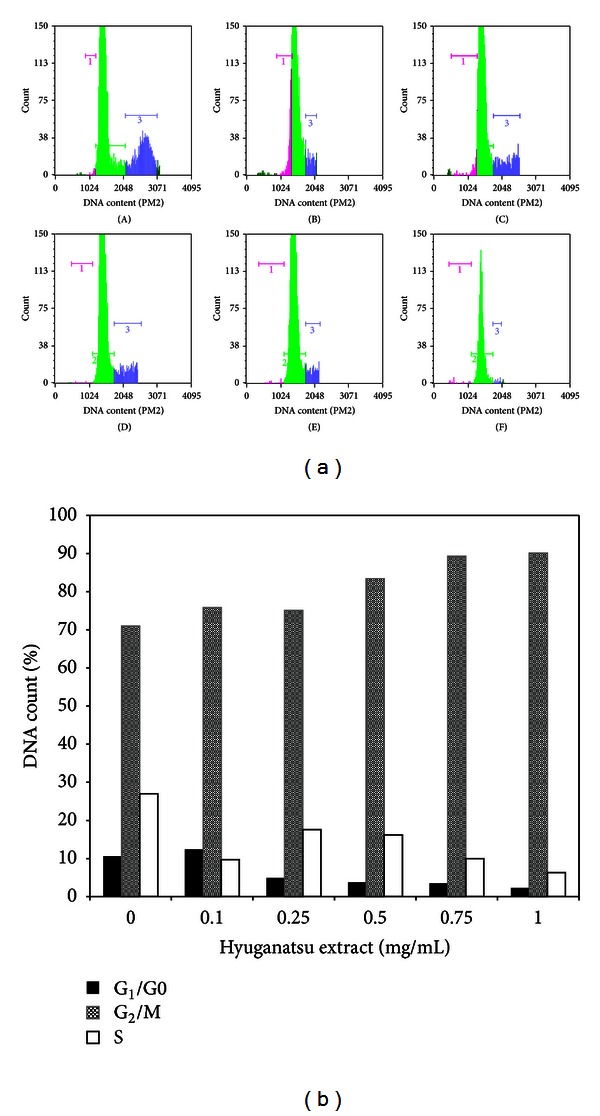
Figure 4.

(a) Cell cycle analysis. TIG-119 fibroblast was incubated with different concentrations: (A) 0.0 mg/mL, (B) 0.1 mg/mL, (C) 0.25 mg/mL, (D) 0.5 mg/mL, (E) 0.75 mg/mL, and (F) 1.0 mg/mL of HE for 16. Both floating and adherent cells were collected and analyzed by flow cytometry. The inserts show the proportion of cells in each phase and marked with different colors (pink: G1/0 phase: green, G2/M phase, and blue: S phase). (b) The data are expressed (% of each phase) as the mean percentage of each phase from independent experiments.
