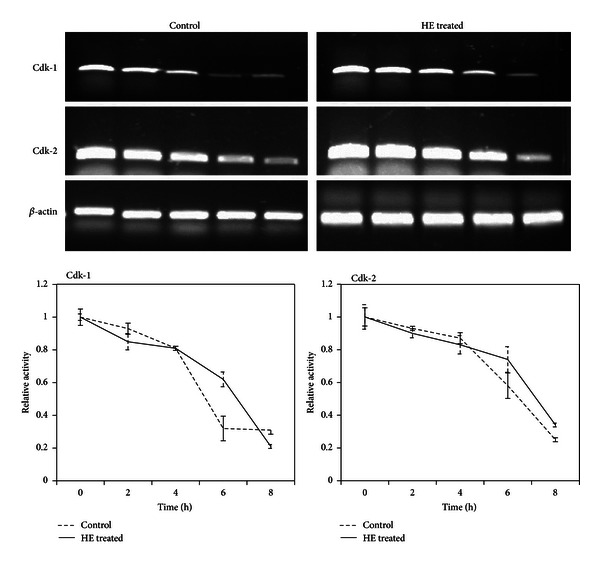
Figure 7.

Transcription inhibition assay. Cdk-1 and -2 mRNA expression levels were measured following the treatment of fibroblasts cells with transcription inhibitor, DRB. Cells were pretreated with DRB for 2 h in serum free medium. Time 0 represents the time of HE addition. Total RNA was collected at various times thereafter and analysed by RT-PCR. Relative gene expressions were calculated plotted.
