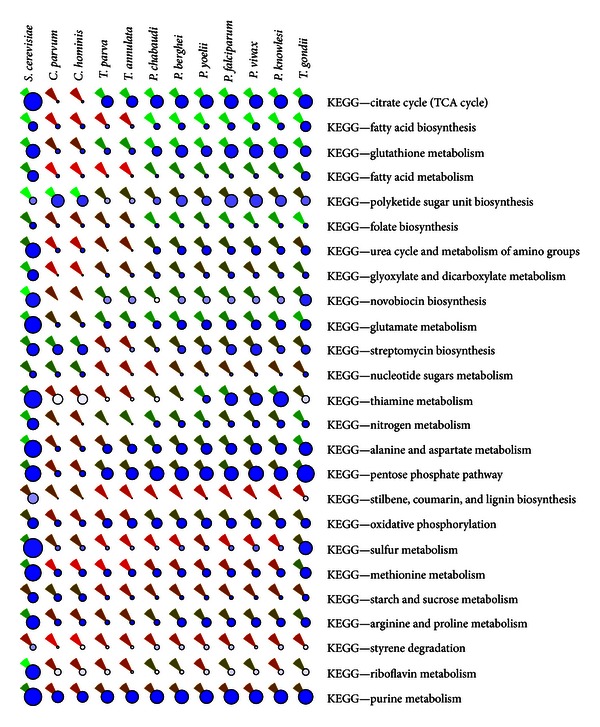
Figure 1.

Pathway scores (excerpt). Completeness, connectedness, and support scores of the inferred metabolic pathways of C. hominis and C. parvum, along with nine other apicomplexans and an external reference (Saccharomyces cerevisiae). The three scores are represented as follows. The color of the circles reflects the support, from white (support of 0) to blue (maximal support). The size of each circle is proportional to the completeness; that is, the larger the circle, the more complete the pathway (see text). The color of the wedge—available for metabolic pathways only—reflects the connectedness, from red (connectedness of 0) to green (connectedness of 100%). Species are clustered according to their completeness score. Pathways are ranked by decreasing power to discriminate between the Cryptosporidium and the other apicomplexans. Only the 25 most discriminative pathways are shown; a complete figure is available as Supplementary Figure 3. All score values are available in Supplementary Table 2.
