Figure 2.

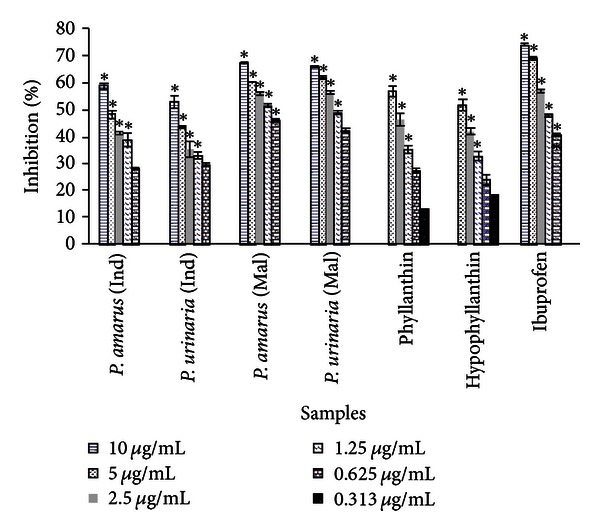
Percentage of inhibition of Phyllanthus sp. and their chemical markers on PMN chemotaxis. Data are mean ± SEM (n = 3). Significance of differences with respective control: *P < 0.05.

Percentage of inhibition of Phyllanthus sp. and their chemical markers on PMN chemotaxis. Data are mean ± SEM (n = 3). Significance of differences with respective control: *P < 0.05.