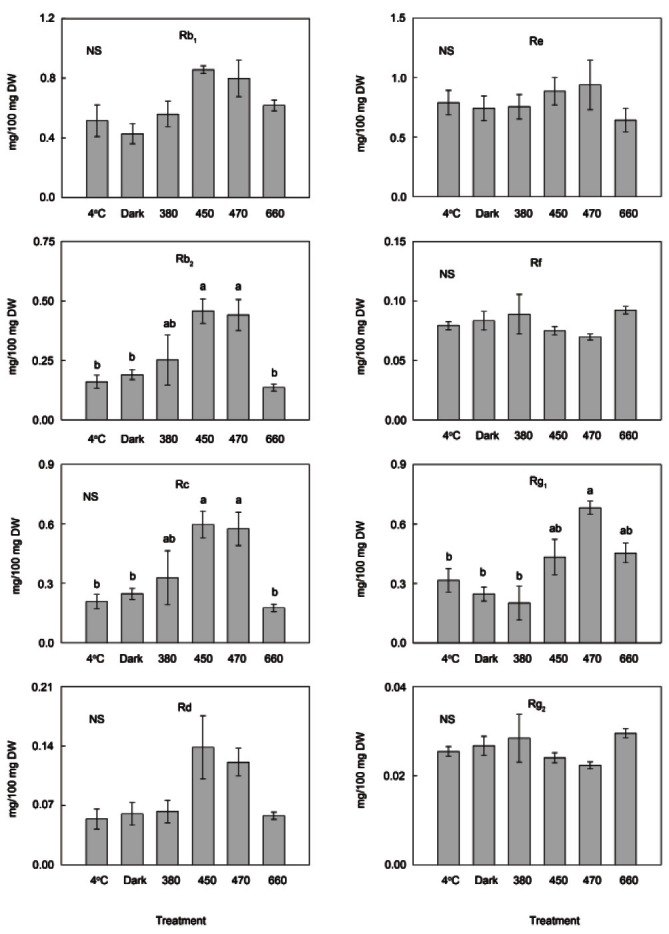
Fig. 2. Comparison of ginsenoside contents. Ginsenoside contents of ginseng roots were compared after treatments with 4℃ and dark as well as light-emitting diodes with 4 different light emission spectra (380, 450, 470, and 670 nm) at 25℃ for 7 d. The content of individual ginsenosides changed after treatments. Values are presented as mean±SE of 3 replications. Significant differences at a 5% level among groups are indicated by different letters above each bar. NS, not significant; DW, dry weight.

