Figure 1.
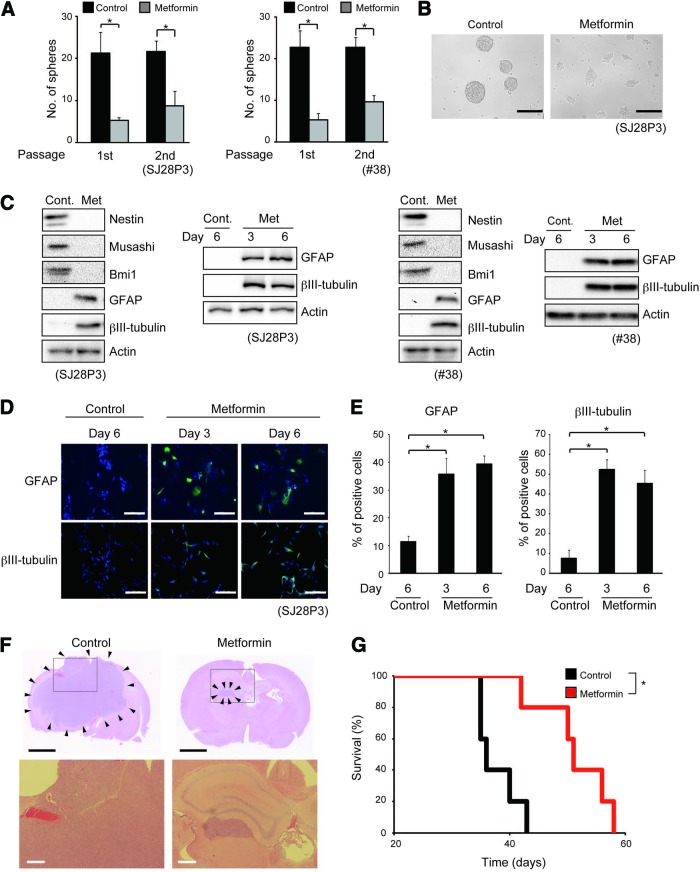
Metformin inhibits self-renewal capacity, induces differentiation, and suppresses tumor-initiating potential of stem-like glioma-initiating cells. (A, B): The indicated stem-like glioma-initiating cells were cultured in the presence of either metformin (1 mM) or vehicle control for 3 days and then subjected to sphere formation assay in the absence of metformin. (A): The number of spheres formed (means ± SD from three independent experiments). (B): Representative photomicrographs of spheres formed by SJ28P3 cells. (C): The indicated cells cultured in the presence of either metformin (1 mM) or vehicle control for 3 days (or 6 days where indicated) were subjected to immunoblot analysis of neural stem cell/progenitor (Nestin, Musashi, and Bmi1) and differentiation (GFAP and βIII-tubulin) marker expression. (D, E): SJ28P3 cells cultured in the presence of either metformin (1 mM) or vehicle control for 3 or 6 days were subjected to immunofluorescence analysis for differentiation marker expression. (D): Representative fluorescence images of GFAP and βIII-tubulin expression (green). Nuclei were counterstained with Hoechst 33342 (blue). (E): The proportion of GFAP (left)- and βIII-tubulin (right)-positive cells was determined. The data represent means ± SD from three independent experiments. (F, G): SJ28P3 cells (1 × 10⁴) cultured in the presence of either metformin (1 mM) or vehicle control for 3 days were implanted intracranially into the brain of nude mice. (F): Representative hematoxylin and eosin staining of brain sections from mice sacrificed 30 days after implantation. The lower panels show magnified views of the boxed areas in the corresponding upper panels. The arrowheads in the upper panels indicate tumor areas. (G): Kaplan-Meier plot showing survival of mice (five mice per group) after intracranial implantation. Scale bars = 200 μm (B), 100 μm (D), 2 mm ([F], top), and 200 μm ([F], bottom). *, p < .05. Abbreviations: Cont., control; GFAP, glial fibrillary acidic protein; Met, metformin.

