Figure 1.
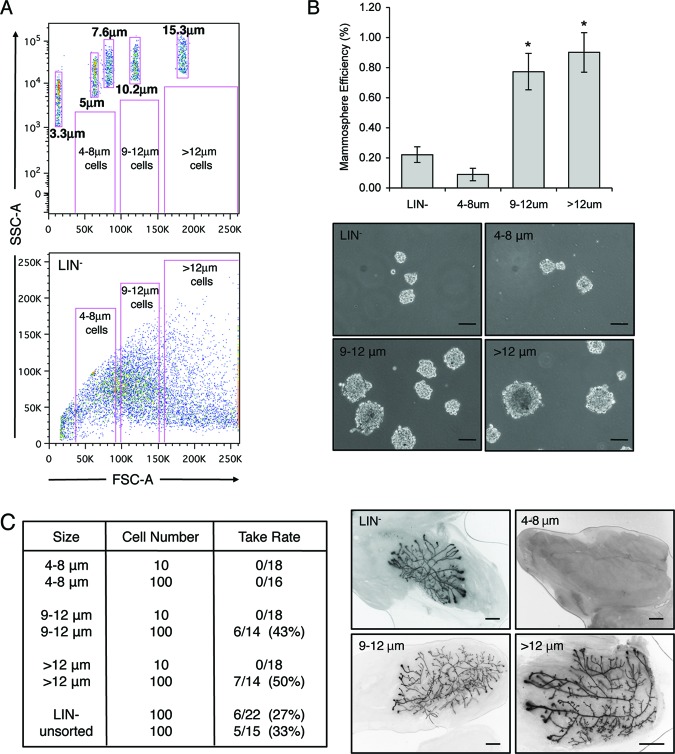
Cells >8 μm in size are enriched for mammary stem cell activity. (A): Top: Exponential dot plot depicting sizing beads and theoretical gates for different sized cell populations. Bottom: Linear dot plot depicting LIN− cells, which were sorted by fluorescence-activated cell sorting on the basis of size. (B): Graph illustrates the number of secondary mammospheres formed per 5,000 cells, expressed as mammosphere efficiency of different cell sizes. The abilities of cells 9–12 μm in size and cells >12 μm in size were significantly increased as compared with LIN− cells and cells 4–8 μm in size (*, p < .0001). Data represent mean ± SEM. Representative images of mammospheres from each group are shown. Scale bars = 100 μm. (C): Table indicates repopulation activity as a function of cell size. Whereas cells 4–8 μm in size lacked outgrowth potential, cells larger than 8 μm had increased outgrowth potential as compared with LIN− and unsorted controls. Images depict representative outgrowths from 100 transplanted cells of each group. Scale bars = 5 mm. Abbreviations: FSC, forward scatter; LIN−, lineage-negative; SSC, side scatter.

