Figure 4.
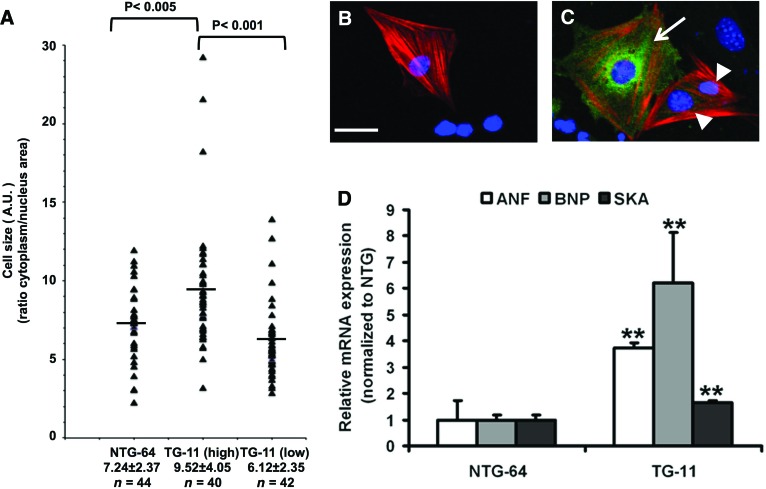
Cardiomyocytes derived from R120G αB-crystallin (CryAB) TG induced pluripotent stem cells (iPSCs) show hypertrophic features. (A–C): Thirty days after EB differentiation, cells from beating NTG-64 and TG-11 samples were dissociated, replated, and stained ([B, C] as in Fig. 3D). (A): Cell and nucleus surface of cardiac troponin T (cTnT)-positive cardiomyocytes of representative NTG-64 and TG-11 lines were measured using ImageJ, and relative values are shown in the graph with an indication of the mean relative value (horizontal line). (B, C): Cardiomyocytes derived from NTG and TG iPSC were stained for cTnT and CryAB. (B): NTG iPSC-derived cardiomyocytes (iCMs) had a very low and therefore barely detectable level of CryAB. (C): CryAB staining of TG iCMs revealed two populations of cells with high and low levels of expression. Scale bar = 50 μm. (D): Quantitative polymerase chain reaction analysis of hypertrophy gene markers such as ANF, BNP, and SKA revealed a significant increase in TG-11 fluorescence-activated cell sorting (FACS)-enriched cardiomyocytes compared with NTG-64 FACS-enriched cardiomyocytes. The cardiomyocytes used for the quantitative PCR analysis experiment contained approximately 60% cardiomyocyte purity. Data are represented as mean ± SD. n = 3; **, p < .05 (Student's t test). (A full list of abbreviations is given in the supplemental online data.) Abbreviations: A.U., arbitrary units; ANF, atrial natriuretic factor; BNP, B-type natriuretic peptide; NTG, nontransgenic; SKA, α-skeletal α-actin; TG, transgenic.

