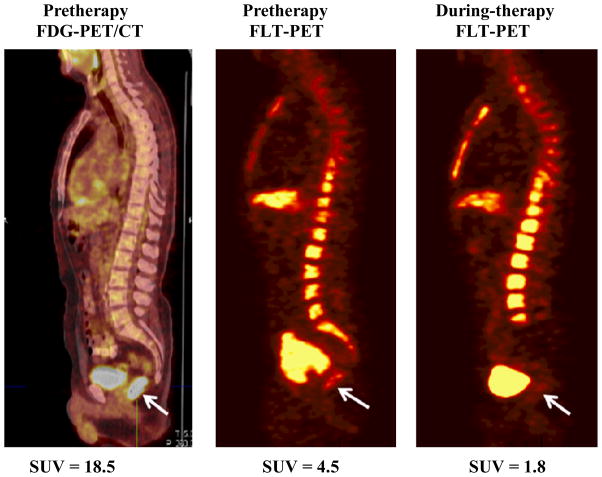
Figure 1.
Representative pretherapy sagittal FDG-PET image registered to CT image (left), pretherapy FLT-PET (middle) and during-therapy FLT-PET images in a patient with rectal cancer (#13) showing increased accumulation in of FDG and FLT prior to initiation of therapy (arrows). Decreased FLT uptake is seen in the rectal cancer and lower lumbar spine and sacrum in mid therapy.

