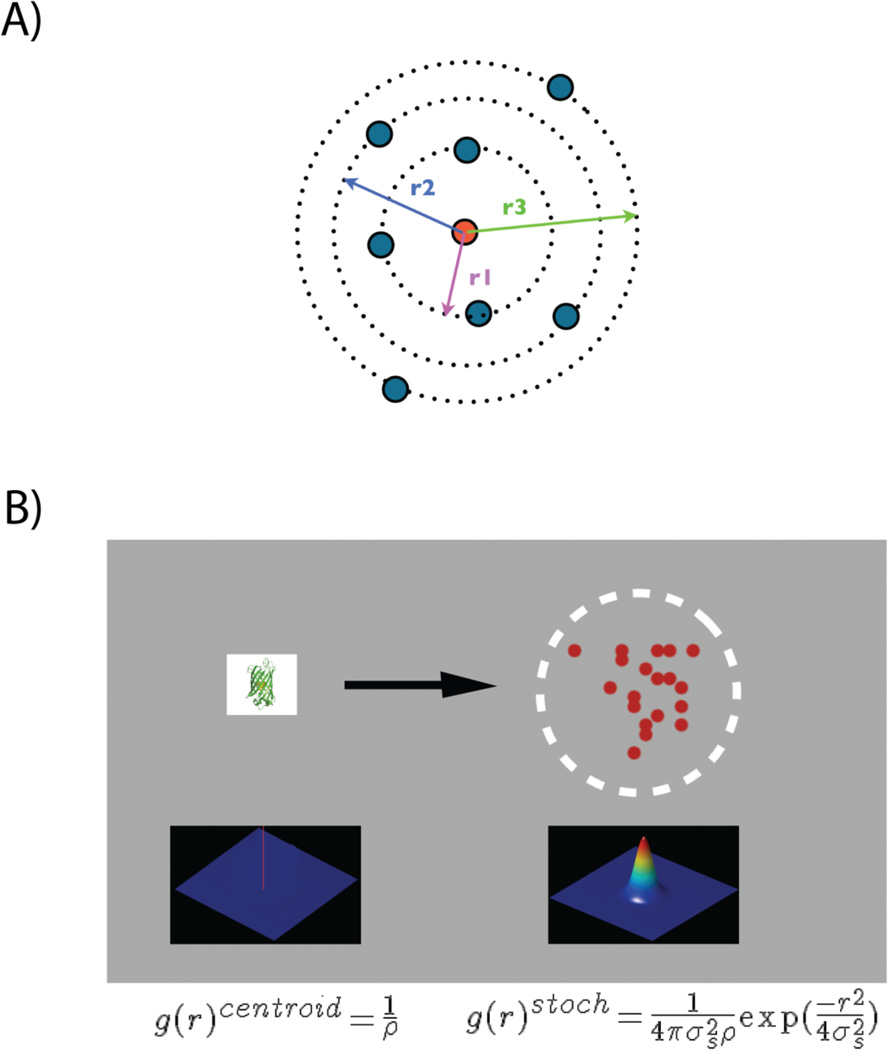
Figure 3.
A: Pair-correlation analysis quantifies the probability of finding a second protein at a certain distance r (represented by r1, r2 and r3) away from a given protein (central red circle) compared to random distribution. B: A single protein is represented by a cluster of peaks distributed over a 2D-surface representing the PSF of localization uncertainty of the PALM experiment. Autocorrelation function of the protein at r=0, g(r)centroid, is a delta function represented by red spike at the centroid of the protein. g(r)centroid is convolved with the autocorrelation function of the PSF. The resulting Gaussian function, g(r)stoch, quantifies the spatial distribution of multiple peaks arising from a single molecule.

