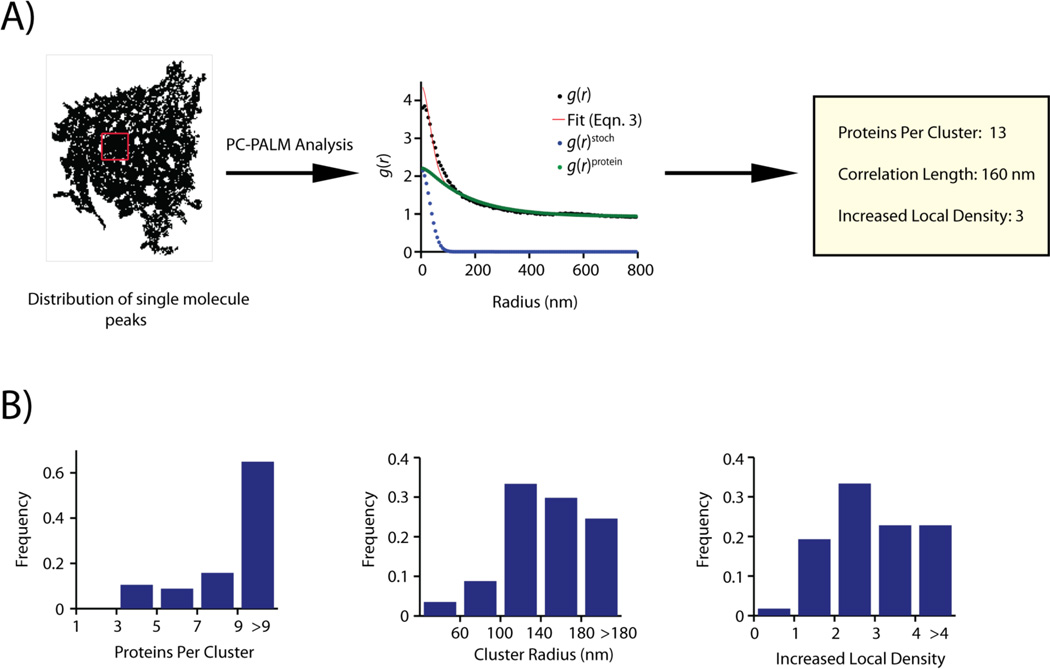
Figure 4.
A: Distribution of single molecule peaks of Lyn-PAGFP across the plasma membrane of a COS-7 cell. Peaks collected in individual frames are combined together. A sub-section of the cell, shown in the red box, is used for pair-correlation analysis. Correlation function of the distribution of peaks (black circles) could be fit to a clustered model using Eqn. 3 (red line). Correlation describing multiple appearances of a single fluorescent protein (g(r)stoch, blue circle) was evaluated from the fit. The protein correlation function (g(r)protein, green circles) is calculated by subtracting g(r)stoch from the measured correlation function. Using g(r)protein, physical parameters describing the nanoscale organization of Lyn-PAGFP could be determined. B: Distribution of cluster parameters evaluated by pair-correlation analysis of spatial distribution of Lyn-PAGFP across plasma membrane of COS-7 cells. Lyn-PAGFP is organized into clusters of 3 or more proteins, and the clusters have a wide range of sizes (60nm – >180nm). Most clusters of Lyn have increased local density ranging from 2 to > 4. Images adapted from Reference [23].

